

[Capture the bottom and reversal!!] Counter-trend line and mBDSR (RCI 2-filter) sell signal on pullback and buying signal on dip
Indicator that captures “tops/bottoms and reversals” in combination with RCI: 【mBDSR】
Methods, and Case Studies (PDF) ★GogoJungle AWARD2020 winner★
https://www.gogojungle.co.jp/tools/indicators/11836
The above products include 301 PDFs. For a list of the PDF titles, please see the article below.
About the 301 PDF files included with 【BODSOR・mBDSR】
https://www.gogojungle.co.jp/finance/navi/articles/34271
Euro/GBP 30-minute chart
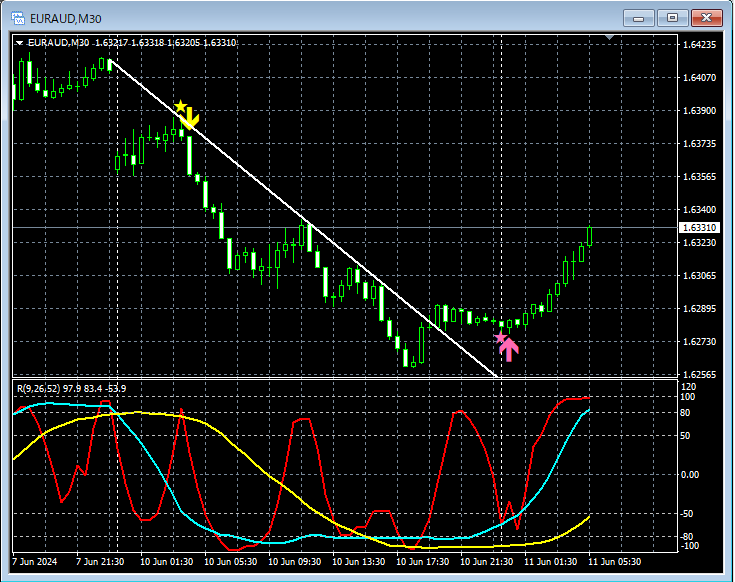
(1)mBDSR’s (two RCI lines) selling signalDecline after the signal lights up.
(2)Counter-trend lineBreaks upward.
(3)mBDSR’s (two RCI lines) buying signal on pullbackRise after the signal lights up.
From this example,a trading method focused on the counter-trend lineandthe compatibility with mBDSR signalsare evident.
Indicator that shines in combination with RCI【BODSOR・mBDSR】
Methods and Case Studies (PDF) ★GogoJungle AWARD2020 winner★
https://www.gogojungle.co.jp/tools/indicators/11836
The PDF files include 301 items (over 1,000 pages, over 350,000 characters in total).
Most of them are focused on systematically linking higher and lower timeframes using three RCI lines, then examining multiple lower timeframes step by step, ultimately waiting for pullbacks or rebounds on the lower timeframes (i.e., mBDSR signals).This is what they have been compiled to show.
Additionally,many of them emphasize identifying points where multiple entry reasons overlap.
In the explanations,over 1,000 chartsare used.

Methods, and Case Studies (PDF) ★GogoJungle AWARD2020 winner★
https://www.gogojungle.co.jp/tools/indicators/11836
The above products include 301 PDFs. For a list of the PDF titles, please see the article below.
About the 301 PDF files included with 【BODSOR・mBDSR】
https://www.gogojungle.co.jp/finance/navi/articles/34271
Euro/GBP 30-minute chart
(1)mBDSR’s (two RCI lines) selling signalDecline after the signal lights up.
(2)Counter-trend lineBreaks upward.
(3)mBDSR’s (two RCI lines) buying signal on pullbackRise after the signal lights up.
From this example,a trading method focused on the counter-trend lineandthe compatibility with mBDSR signalsare evident.
Indicator that shines in combination with RCI【BODSOR・mBDSR】
Methods and Case Studies (PDF) ★GogoJungle AWARD2020 winner★
https://www.gogojungle.co.jp/tools/indicators/11836
The PDF files include 301 items (over 1,000 pages, over 350,000 characters in total).
Most of them are focused on systematically linking higher and lower timeframes using three RCI lines, then examining multiple lower timeframes step by step, ultimately waiting for pullbacks or rebounds on the lower timeframes (i.e., mBDSR signals).This is what they have been compiled to show.
Additionally,many of them emphasize identifying points where multiple entry reasons overlap.
In the explanations,over 1,000 chartsare used.
× ![]()


