

[Capture the Market Bottom and Reversal!!] Previous high and the neckline of the double top, and the mBDSR (RCI two-line filter) sell signal on the pullback
0
Indicator that captures the bottom/top reversal in combination with RCI【mBDSR】
Methods and Case Studies (PDF) ★GogoJungle AWARD2020 winner★
https://www.gogojungle.co.jp/tools/indicators/11836
The above products include 301 PDFs. For lists of these PDFs’ titles and other details, please refer to the article below.
About the 301 PDF files included with【BODSOR・mBDSR】
https://www.gogojungle.co.jp/finance/navi/articles/34271
Euro/Australia Dollar 4-hour chart
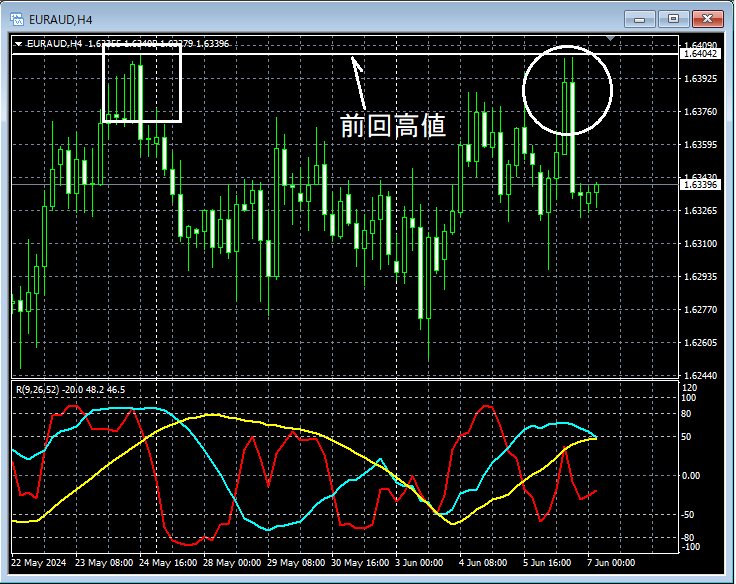
If you look at the area encircled by a white circle on the 1-hour chart above,previous highhas risen toward the vicinity, and thishorizontal linemay present a scenario where it would not be unusual to consider a pullback sell on lower timeframes until it clearly breaks above.
Euro/Australian Dollar 5-minute chart
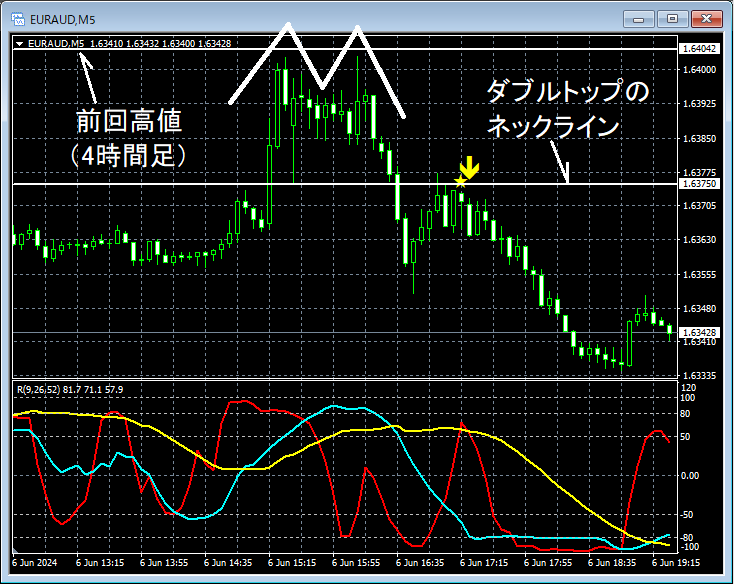
In the 5-minute chart above, the price rises to near theprevious highon the 4-hour level,forming a double topand then falls back. And around thedouble topnear the neck linenecks line areathe mBDSR (filter: RCI26 and RCI52) sell signallights up and continues to drop.
From this example,a trading approach that focuses on resistance levels, double tops, and their neck linesandthe signals of mBDSRappears to have strong compatibility.
Indicator that shines in combination with RCI【BODSOR・mBDSR】
Methods and Case Studies (PDF) ★GogoJungle AWARD2020 winner★
https://www.gogojungle.co.jp/tools/indicators/11836
The PDF files consist of 301 items (over 1,000 pages in total, over 350,000 characters in total).
Many of them are prepared to systematically discuss the situations of multiple lower timeframes by logically linking the higher and lower timeframes using three RCI lines, ultimately waiting for pullback buy or retracement sell timing (i.e., the mBDSR signal) on the lower timeframes.Additionally,
many focus on identifying points where multiple entry reasons overlap.They also utilize over 1,000 chart images for explanations.

Methods and Case Studies (PDF) ★GogoJungle AWARD2020 winner★
https://www.gogojungle.co.jp/tools/indicators/11836
The above products include 301 PDFs. For lists of these PDFs’ titles and other details, please refer to the article below.
About the 301 PDF files included with【BODSOR・mBDSR】
https://www.gogojungle.co.jp/finance/navi/articles/34271
Euro/Australia Dollar 4-hour chart
If you look at the area encircled by a white circle on the 1-hour chart above,previous highhas risen toward the vicinity, and thishorizontal linemay present a scenario where it would not be unusual to consider a pullback sell on lower timeframes until it clearly breaks above.
Euro/Australian Dollar 5-minute chart
In the 5-minute chart above, the price rises to near theprevious highon the 4-hour level,forming a double topand then falls back. And around thedouble topnear the neck linenecks line areathe mBDSR (filter: RCI26 and RCI52) sell signallights up and continues to drop.
From this example,a trading approach that focuses on resistance levels, double tops, and their neck linesandthe signals of mBDSRappears to have strong compatibility.
Indicator that shines in combination with RCI【BODSOR・mBDSR】
Methods and Case Studies (PDF) ★GogoJungle AWARD2020 winner★
https://www.gogojungle.co.jp/tools/indicators/11836
The PDF files consist of 301 items (over 1,000 pages in total, over 350,000 characters in total).
Many of them are prepared to systematically discuss the situations of multiple lower timeframes by logically linking the higher and lower timeframes using three RCI lines, ultimately waiting for pullback buy or retracement sell timing (i.e., the mBDSR signal) on the lower timeframes.Additionally,
many focus on identifying points where multiple entry reasons overlap.They also utilize over 1,000 chart images for explanations.
× ![]()


