

[Capture the Market Bottom and Reversal!!] A sign of three-line RCI, the pin bar, the perceived horizontal line, the third trough test, and the mBDSR signal
Indicator that captures “bottoming and reversal” when combined with RCI: 【mBDSR】
Methods and Case Studies (PDF) ★GogoJungle AWARD 2020 Winner★
https://www.gogojungle.co.jp/tools/indicators/11836
The above products include 301 PDFs. For the list of their PDF titles and related information, please see the article below.
Regarding the 301 PDF files included with 【BODSOR・mBDSR】
https://www.gogojungle.co.jp/finance/navi/articles/34271
USDCAD 4-hour chart
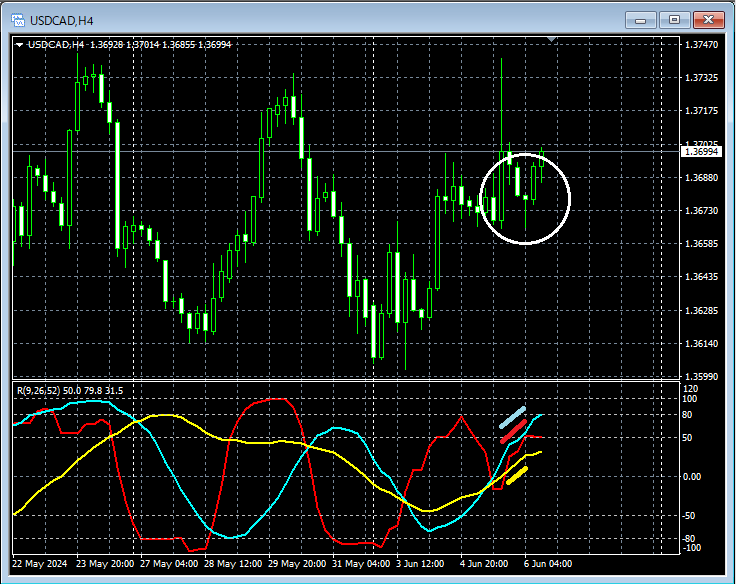
If you look at the area encircled in white on the 4-hour chart aboveRCI three-lineis showing a strong upward trend together. It suggests a potential rise.Pin Bar(a candle with a long lower wick) is also present, so it might not be strange to look for a pullback-buy opportunity on lower timeframes.
USDCAD 1-hour chart
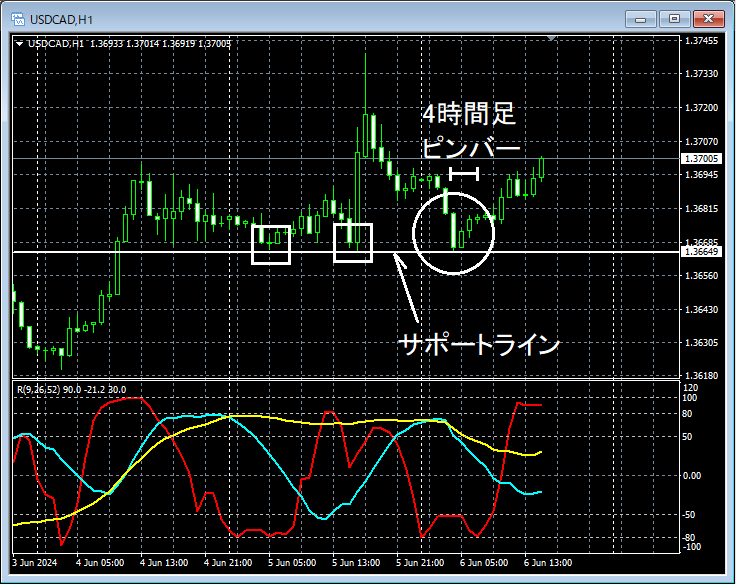
Looking at the area encircled in white on the 1-hour chart above, the Pin Bar seen on the 4-hour chart remains visible on the 1-hour chartand is formed near a horizontal support line that the chart recognizes as supportnearby. This could be seen as the third attempt at making a new low.Until this horizontal line is clearly broken, it may not be strange to consider a pullback-buy on lower timeframes.
USDCAD 15-minute chart
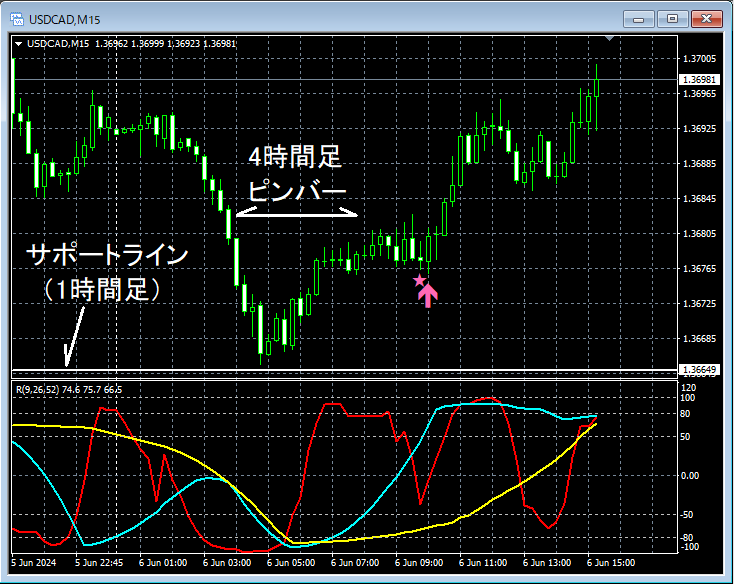
On the 15-minute chart above, after the Pin Bar on the 4-hour chart appeared and the price rose, there was a retracementmBDSR (Filter: RCI26 and RCI52) pullback-buy signalreddening and continued to rise.
From this example,the high compatibility between trades that focus on Pin Bars and floor-plan horizontal support levels and the signals of mBDSRis evident.
Indicator that shines when combined with RCI: 【BODSOR・mBDSR】
Methods and Case Studies (PDF) ★GogoJungle AWARD 2020 Winner★
https://www.gogojungle.co.jp/tools/indicators/11836
The PDF file includes 301 PDFs (over 1,000 pages, over 350,000 words in total).
Many of them are summaries of cases where the upper and lower timeframes are logically linked using the RCI three-line, sequentially examining multiple lower-timeframe conditions, and ultimately waiting for pullback buys or pullback sells on the lower timeframe (i.e., mBDSR signals)..
Additionally,many focus on capturing points where multiple entry reasons overlap..
In the explanations,more than 1,000 chartsare used.

Methods and Case Studies (PDF) ★GogoJungle AWARD 2020 Winner★
https://www.gogojungle.co.jp/tools/indicators/11836
The above products include 301 PDFs. For the list of their PDF titles and related information, please see the article below.
Regarding the 301 PDF files included with 【BODSOR・mBDSR】
https://www.gogojungle.co.jp/finance/navi/articles/34271
USDCAD 4-hour chart
If you look at the area encircled in white on the 4-hour chart aboveRCI three-lineis showing a strong upward trend together. It suggests a potential rise.Pin Bar(a candle with a long lower wick) is also present, so it might not be strange to look for a pullback-buy opportunity on lower timeframes.
USDCAD 1-hour chart
Looking at the area encircled in white on the 1-hour chart above, the Pin Bar seen on the 4-hour chart remains visible on the 1-hour chartand is formed near a horizontal support line that the chart recognizes as supportnearby. This could be seen as the third attempt at making a new low.Until this horizontal line is clearly broken, it may not be strange to consider a pullback-buy on lower timeframes.
USDCAD 15-minute chart
On the 15-minute chart above, after the Pin Bar on the 4-hour chart appeared and the price rose, there was a retracementmBDSR (Filter: RCI26 and RCI52) pullback-buy signalreddening and continued to rise.
From this example,the high compatibility between trades that focus on Pin Bars and floor-plan horizontal support levels and the signals of mBDSRis evident.
Indicator that shines when combined with RCI: 【BODSOR・mBDSR】
Methods and Case Studies (PDF) ★GogoJungle AWARD 2020 Winner★
https://www.gogojungle.co.jp/tools/indicators/11836
The PDF file includes 301 PDFs (over 1,000 pages, over 350,000 words in total).
Many of them are summaries of cases where the upper and lower timeframes are logically linked using the RCI three-line, sequentially examining multiple lower-timeframe conditions, and ultimately waiting for pullback buys or pullback sells on the lower timeframe (i.e., mBDSR signals)..
Additionally,many focus on capturing points where multiple entry reasons overlap..
In the explanations,more than 1,000 chartsare used.
× ![]()


