

【Capture the top-bottom reversal!!】Pin bar on the higher timeframe and the mBDSR pullback sell signal on the lower timeframe
0
Indicator "Catch the Bottom and Reversal" in combination with RCI【mBDSR】
Method・Case Studies (PDF) ★GogoJungle AWARD2020 Winner★
https://www.gogojungle.co.jp/tools/indicators/11836
The above products include 301 PDFs. For a list of the titles of those PDFs, please refer to the article below.
About the 301 PDF files included with 【BODSOR・mBDSR】
https://www.gogojungle.co.jp/finance/navi/articles/34271
AUDUSD 4-hour chart
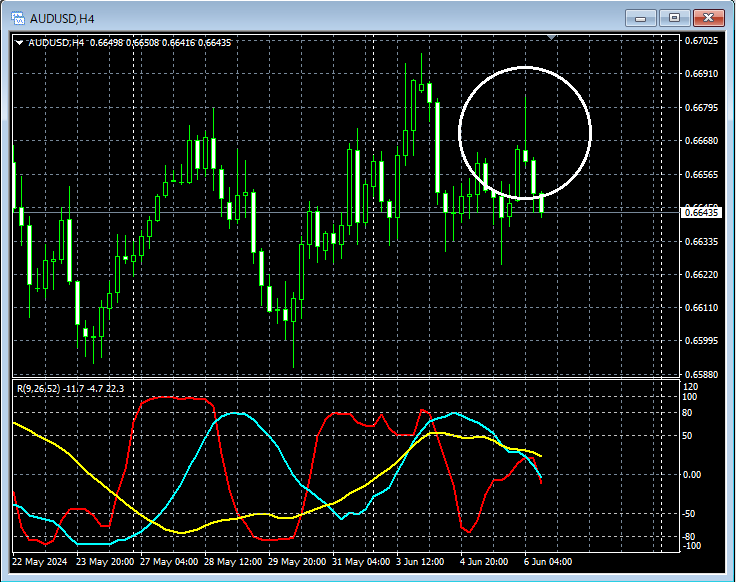
Looking at the area circled in white on the 4-hour chart above, it suggests a declinePin Bar(a candlestick with a long upper shadow) appears, and even if you think about selling on a lower timeframe rally, this may be a reasonable scenario. In this casePin Baris a pattern where traders who jumped in during strong upwards movement can get trapped. Public sentiment is interpreted as turning downward (bearish).
AUDUSD 15-minute chart
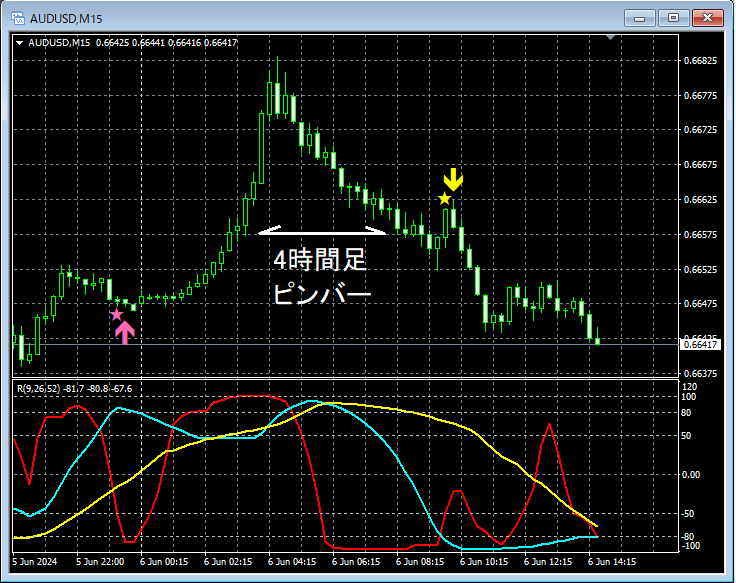
On the 15-minute chart above, after aPin Barappears on the 4-hour chart, the price declines and then rises againmBDSR (Filter: RCI26 and RCI52) Sell-Back Signallights up and continues to fall.
From this example,trade method focused on Pin BarandmBDSR signalsshow high compatibility.
Indicator that shines in combination with RCI: 【BODSOR・mBDSR】
Method・Case Studies (PDF) ★GogoJungle AWARD2020 Winner★
https://www.gogojungle.co.jp/tools/indicators/11836
The PDF files include 301 items (over 1,000 pages, over 350,000 characters in total).
Many of them aresummaries of cases where multiple lower-timeframe conditions are logically linked with higher timeframes using 3 lines of RCI to examine multiple lower-timeframe conditions in sequence, ultimately waiting for an entry on the lower timeframe (i.e., mBDSR signal) such as a pullback buy or a pullback sell..
Also,many of them focus on capturing points where multiple entry reasons converge..
In the explanations,more than 1,000 chartsare used.

Method・Case Studies (PDF) ★GogoJungle AWARD2020 Winner★
https://www.gogojungle.co.jp/tools/indicators/11836
The above products include 301 PDFs. For a list of the titles of those PDFs, please refer to the article below.
About the 301 PDF files included with 【BODSOR・mBDSR】
https://www.gogojungle.co.jp/finance/navi/articles/34271
AUDUSD 4-hour chart
Looking at the area circled in white on the 4-hour chart above, it suggests a declinePin Bar(a candlestick with a long upper shadow) appears, and even if you think about selling on a lower timeframe rally, this may be a reasonable scenario. In this casePin Baris a pattern where traders who jumped in during strong upwards movement can get trapped. Public sentiment is interpreted as turning downward (bearish).
AUDUSD 15-minute chart
On the 15-minute chart above, after aPin Barappears on the 4-hour chart, the price declines and then rises againmBDSR (Filter: RCI26 and RCI52) Sell-Back Signallights up and continues to fall.
From this example,trade method focused on Pin BarandmBDSR signalsshow high compatibility.
Indicator that shines in combination with RCI: 【BODSOR・mBDSR】
Method・Case Studies (PDF) ★GogoJungle AWARD2020 Winner★
https://www.gogojungle.co.jp/tools/indicators/11836
The PDF files include 301 items (over 1,000 pages, over 350,000 characters in total).
Many of them aresummaries of cases where multiple lower-timeframe conditions are logically linked with higher timeframes using 3 lines of RCI to examine multiple lower-timeframe conditions in sequence, ultimately waiting for an entry on the lower timeframe (i.e., mBDSR signal) such as a pullback buy or a pullback sell..
Also,many of them focus on capturing points where multiple entry reasons converge..
In the explanations,more than 1,000 chartsare used.
× ![]()


