

[Capture the Bottom and Reversal!!] Signals of Counter-Trend Line, Double Bottom, and mBDSR (RCI two-line filter)
Indicator that captures the bottom and reversal when combined with RCI: 【mBDSR】
Method and Case Study (PDF) ★GogoJungle AWARD2020 Winner★
https://www.gogojungle.co.jp/tools/indicators/11836
The above products include 301 PDFs. For a list of their PDF titles, please see the article below.
About the 301 PDF files accompanying 【BODSOR・mBDSR】
https://www.gogojungle.co.jp/finance/navi/articles/34271
USD/JPY 15-minute chart
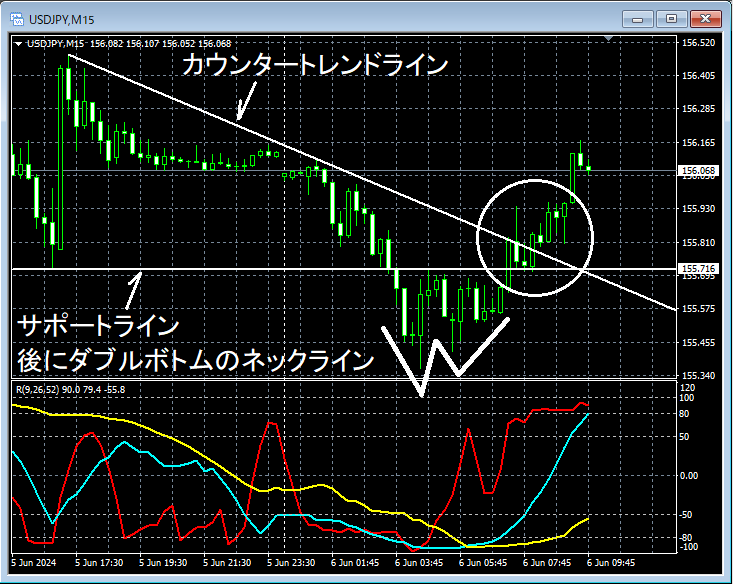
Looking at the 15-minute chart above,a Double Bottomforms and the price rises,the Counter-trend Lineis temporarily broken upward. We will examine the area encircled in white in more detail on a lower time frame.
Double BottomandBreakout of the Downtrend Linecan be interpreted as chart patterns that signal a trend reversal from down to up.
USD/JPY 5-minute chart
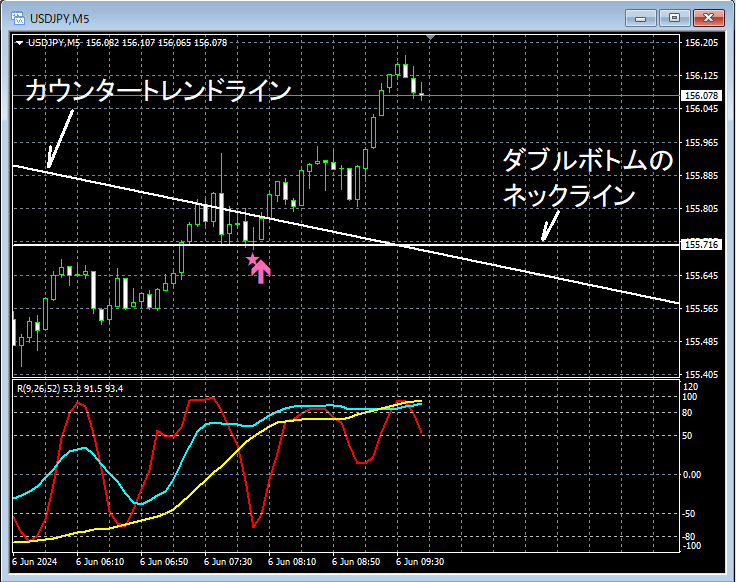
On the 5-minute chart above,Counter-trend Lineis briefly broken upward andnecks line of the Double Bottomis reached,mBDSR's (RCI2-filter) buy-the-dip signallights up, and price subsequently rises steadily.
From this example,the synergy between a trading method focusing on Double Bottoms and Counter-trend LinesandmBDSR signalsis evident.
Indicator that shines when combined with RCI: 【BODSOR・mBDSR】
Method and Case Study (PDF) ★GogoJungle AWARD2020 Winner★
https://www.gogojungle.co.jp/tools/indicators/11836
The PDF files include 301 items (over 1,000 pages, over 350,000 characters in total).
Many of them describe a method of logically linking the higher and lower timeframes using three RCI lines, resulting in examining the conditions of multiple lower timeframes sequentially, and ultimately waiting for a buy-the-dip or sell-the-rally signal on the lower timeframes (i.e., mBDSR signals).It is summarized in that form.
Additionally,many of them emphasize identifying points where multiple entry reasons converge..
In the explanations,over 1,000 chartsare used.

Method and Case Study (PDF) ★GogoJungle AWARD2020 Winner★
https://www.gogojungle.co.jp/tools/indicators/11836
The above products include 301 PDFs. For a list of their PDF titles, please see the article below.
About the 301 PDF files accompanying 【BODSOR・mBDSR】
https://www.gogojungle.co.jp/finance/navi/articles/34271
USD/JPY 15-minute chart
Looking at the 15-minute chart above,a Double Bottomforms and the price rises,the Counter-trend Lineis temporarily broken upward. We will examine the area encircled in white in more detail on a lower time frame.
Double BottomandBreakout of the Downtrend Linecan be interpreted as chart patterns that signal a trend reversal from down to up.
USD/JPY 5-minute chart
On the 5-minute chart above,Counter-trend Lineis briefly broken upward andnecks line of the Double Bottomis reached,mBDSR's (RCI2-filter) buy-the-dip signallights up, and price subsequently rises steadily.
From this example,the synergy between a trading method focusing on Double Bottoms and Counter-trend LinesandmBDSR signalsis evident.
Indicator that shines when combined with RCI: 【BODSOR・mBDSR】
Method and Case Study (PDF) ★GogoJungle AWARD2020 Winner★
https://www.gogojungle.co.jp/tools/indicators/11836
The PDF files include 301 items (over 1,000 pages, over 350,000 characters in total).
Many of them describe a method of logically linking the higher and lower timeframes using three RCI lines, resulting in examining the conditions of multiple lower timeframes sequentially, and ultimately waiting for a buy-the-dip or sell-the-rally signal on the lower timeframes (i.e., mBDSR signals).It is summarized in that form.
Additionally,many of them emphasize identifying points where multiple entry reasons converge..
In the explanations,over 1,000 chartsare used.
× ![]()


