

[Risk-reward favorable, high-advantage trade] Rebound at the moving average you focus on and the mBDSR (RCI Two-Filters) buying signal on pullback
0
Indicator 【mBDSR】 that captures “top and bottom reversal” in combination with RCI
with methods and case studies (PDF) ★GogoJungle AWARD2020 winner★
https://www.gogojungle.co.jp/tools/indicators/11836
The above products include 301 PDFs. For a list of those PDF titles, please see the article below.
About the 301 PDF files included with 【BODSOR・mBDSR】
https://www.gogojungle.co.jp/finance/navi/articles/34271
AUDCHF 30-minute chart
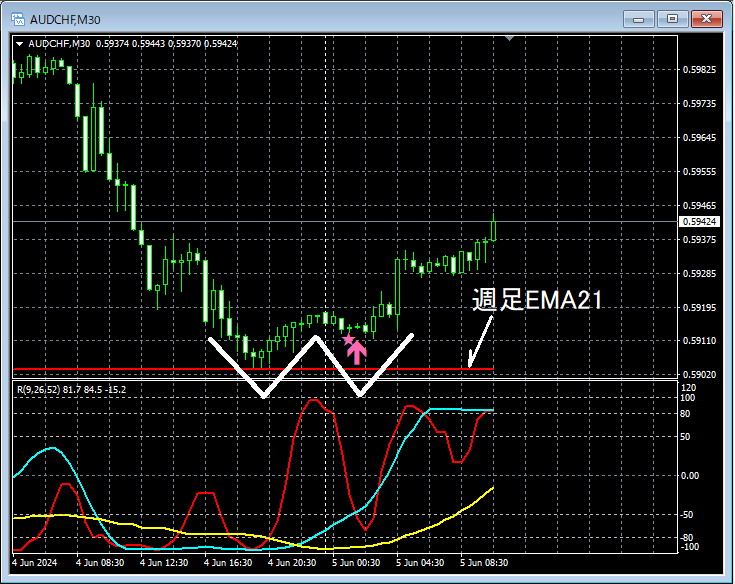
Regarding the higher timeframe, it is omitted. Looking at the area circled with a white circle on the 30-minute chart above, this case emphasizesWeekly EMA21descending to near that level anddouble bottomforming and rebounding, and clearly rising. Thatdouble bottomon the right side forms a valley andmBDSR (Filter: RCI26 and RCI52) pullback buy signallights up.
From this example,a trading method focused on moving averagesandthe signal of mBDSRshow a high level of compatibility.
Also, as in this example,the pullback buy signal of mBDSR (Filter: RCI26 and RCI52) on the right-side valley of the double bottomlights up, and by placing the stop loss a little below the left-side valley of the double bottom,you can achieve a high-risk-reward favorable tradewith strong edge.
Indicator that shines in combination with RCI【BODSOR・mBDSR】
with methods and case studies (PDF) ★GogoJungle AWARD2020 winner★
https://www.gogojungle.co.jp/tools/indicators/11836
The PDF file includes 301 items (over 1,000 pages in total, over 350,000 characters).
Many of them areexamples that link multiple lower-timeframe conditions logically with higher timeframes using three-line RCI, and eventually lay out a form that waits for pullbacks or rallies on the lower timeframes (i.e., mBDSR signals).in detail.
Also,many are focused on capturing points where multiple entry reasons overlap.as well.
In the explanations,more than 1,000 chartsare used.

with methods and case studies (PDF) ★GogoJungle AWARD2020 winner★
https://www.gogojungle.co.jp/tools/indicators/11836
The above products include 301 PDFs. For a list of those PDF titles, please see the article below.
About the 301 PDF files included with 【BODSOR・mBDSR】
https://www.gogojungle.co.jp/finance/navi/articles/34271
AUDCHF 30-minute chart
Regarding the higher timeframe, it is omitted. Looking at the area circled with a white circle on the 30-minute chart above, this case emphasizesWeekly EMA21descending to near that level anddouble bottomforming and rebounding, and clearly rising. Thatdouble bottomon the right side forms a valley andmBDSR (Filter: RCI26 and RCI52) pullback buy signallights up.
From this example,a trading method focused on moving averagesandthe signal of mBDSRshow a high level of compatibility.
Also, as in this example,the pullback buy signal of mBDSR (Filter: RCI26 and RCI52) on the right-side valley of the double bottomlights up, and by placing the stop loss a little below the left-side valley of the double bottom,you can achieve a high-risk-reward favorable tradewith strong edge.
Indicator that shines in combination with RCI【BODSOR・mBDSR】
with methods and case studies (PDF) ★GogoJungle AWARD2020 winner★
https://www.gogojungle.co.jp/tools/indicators/11836
The PDF file includes 301 items (over 1,000 pages in total, over 350,000 characters).
Many of them areexamples that link multiple lower-timeframe conditions logically with higher timeframes using three-line RCI, and eventually lay out a form that waits for pullbacks or rallies on the lower timeframes (i.e., mBDSR signals).in detail.
Also,many are focused on capturing points where multiple entry reasons overlap.as well.
In the explanations,more than 1,000 chartsare used.
× ![]()


