
Go-to Date Reference Rate Trade and mBDSR (RCI2-Filters) Signals
In recent Investment Navigator+ articles,the high affinity between various trading methods and mBDSR signalsis illustrated with many examples.
USD/JPY 15-minute chart
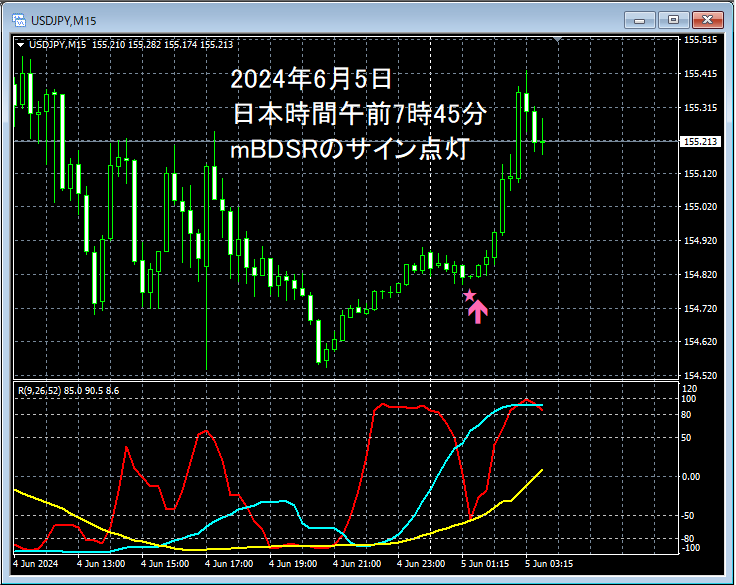
On June 5, 2024, around 7:45 AM Japan time on the so-called Gotō day, in the above 15-minute chartmBDSR (filters: RCI26 and RCI52) pullback buying signallights up and the price rises sharply toward the fixing value. Note that this chart corresponds to the time up to around the fixing time.
From this example,a trading method focused on the fixing time on Gotō dayandthe mBDSR signalshow a strong harmony.
Indicators that excel in combination with RCI: 【BODSOR・mBDSR】
Methods and case studies (PDF) ★GogoJungle AWARD2020 winner★
https://www.gogojungle.co.jp/tools/indicators/11836
The PDF file includes 301 documents (over 1,000 pages, over 350,000 characters in total).
Many of these summarize examples that logically link higher timeframes and lower timeframes using three RCI lines, and finally lay out the pattern of waiting for pullbacks or pullback selling timing on the lower timeframes (i.e., the mBDSR signal).They are also focused on capturing points where multiple entry reasons coincide.
The explanations usemore than 1,000 charts.
