

【 Capture the bottom and reversal!! 】 Fibonacci retracement and mBDSR (RCI 2-band filter) bullish signal
0
An indicator that captures “tops and bottoms and reversals” in combination with RCI [mBDSR]
Methods and Case Studies (PDF) ★GogoJungle AWARD2020 Winner★
https://www.gogojungle.co.jp/tools/indicators/11836
The above products include 301 PDFs. For a list of the PDF titles, please refer to the article below.
About the 301 PDF files included with 【BODSOR・mBDSR】
https://www.gogojungle.co.jp/finance/navi/articles/34271
Pound-Dollar, 1-hour chart
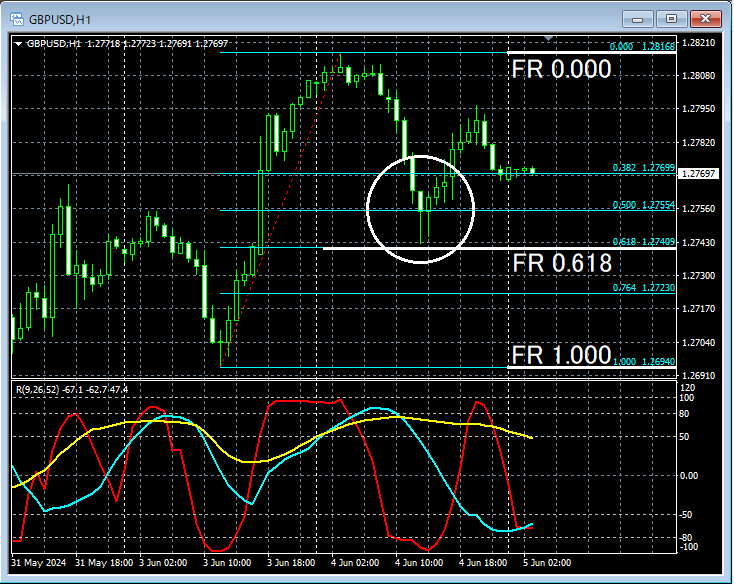
Looking at the area circled in white on the 1-hour chart above, in relation to the recent riseFibonacci Retracement 61.8%It may not be surprising to consider the possibility of a rebound near this level.
Pound-Dollar, 5-minute chart
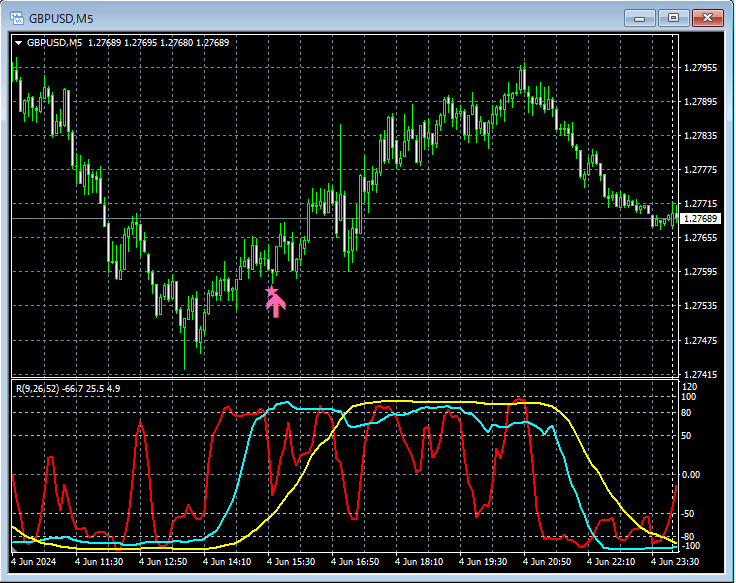
On the 5-minute chart above, after a reboundmBDSR (Filter: RCI26 and RCI52) pullback buy signallights up and the price rises sharply.
From this example,a trading method focusing on Fibonacci Retracementandthe signals of mBDSRshow a strong synergy.
Indicator that shines when combined with RCI: 【BODSOR・mBDSR】
Methods and Case Studies (PDF) ★GogoJungle AWARD2020 Winner★
https://www.gogojungle.co.jp/tools/indicators/11836
There are 301 PDF files included (over 1,000 pages in total, over 350,000 characters).
Many of them are about the approach of logically linking higher and lower timeframes using three RCI lines, examining multiple lower timeframes sequentially, and ultimately waiting for pullback buys or retracements on the lower timeframe (i.e., signals of mBDSR)..
Also,many focus on identifying points where multiple entry reasons overlap..
The explanations useover 1,000 charts.

Methods and Case Studies (PDF) ★GogoJungle AWARD2020 Winner★
https://www.gogojungle.co.jp/tools/indicators/11836
The above products include 301 PDFs. For a list of the PDF titles, please refer to the article below.
About the 301 PDF files included with 【BODSOR・mBDSR】
https://www.gogojungle.co.jp/finance/navi/articles/34271
Pound-Dollar, 1-hour chart
Looking at the area circled in white on the 1-hour chart above, in relation to the recent riseFibonacci Retracement 61.8%It may not be surprising to consider the possibility of a rebound near this level.
Pound-Dollar, 5-minute chart
On the 5-minute chart above, after a reboundmBDSR (Filter: RCI26 and RCI52) pullback buy signallights up and the price rises sharply.
From this example,a trading method focusing on Fibonacci Retracementandthe signals of mBDSRshow a strong synergy.
Indicator that shines when combined with RCI: 【BODSOR・mBDSR】
Methods and Case Studies (PDF) ★GogoJungle AWARD2020 Winner★
https://www.gogojungle.co.jp/tools/indicators/11836
There are 301 PDF files included (over 1,000 pages in total, over 350,000 characters).
Many of them are about the approach of logically linking higher and lower timeframes using three RCI lines, examining multiple lower timeframes sequentially, and ultimately waiting for pullback buys or retracements on the lower timeframe (i.e., signals of mBDSR)..
Also,many focus on identifying points where multiple entry reasons overlap..
The explanations useover 1,000 charts.
× ![]()


