

【Capture the Bottom and Reversal!!】Buy signal on support-turned-resistance and mBDSR (RCI2 two-filter) pullback
0
Indicator that captures “tops and bottoms and reversals” in combination with RCI【mBDSR】
Methods and Case Studies (PDF) ★GogoJungle AWARD2020 Winner★
https://www.gogojungle.co.jp/tools/indicators/11836
The above products include 301 PDFs. For a list of their PDF titles and other details, please refer to the article below.
About the 301 PDF files included with “BODSOR・mBDSR”
https://www.gogojungle.co.jp/finance/navi/articles/34271
Euro/Australian Dollar 5-minute chart
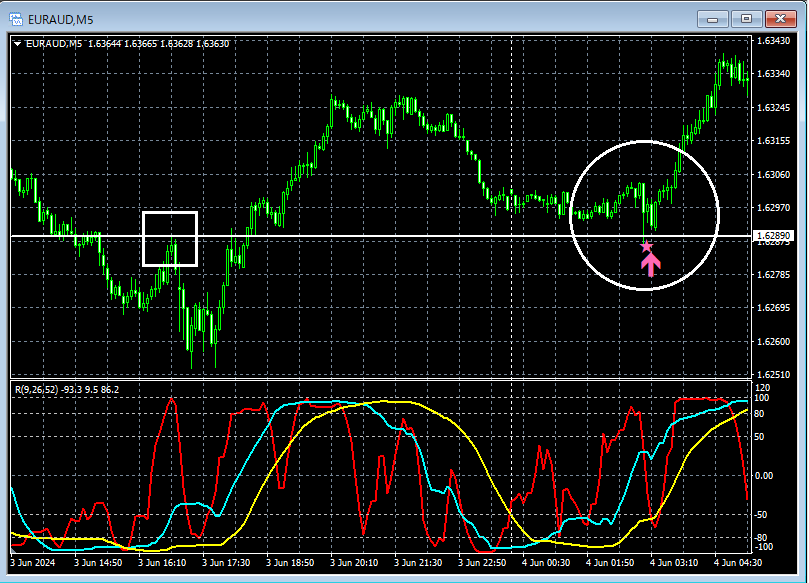
If you look at the area circled with a white circle on the 5-minute chart above,a horizontal line that previously acted as resistancewas revisited downward,mBDSR (filter: RCI26 and RCI52) pullback-buy signalwas lit up and it rose sharply.
From this example,a trading method focused on resistance/ Support turning into resistance and supportandthe harmony with mBDSR signalscan be inferred.
Indicator that shines in combination with RCI:【BODSOR・mBDSR】
Methods and Case Studies (PDF) ★GogoJungle AWARD2020 Winner★
https://www.gogojungle.co.jp/tools/indicators/11836
The PDF files number 301 (over 1,000 pages in total, over 350,000 characters in total).
Many of them document examples where, by logically linking higher and lower timeframes using three RCI lines, multiple lower-timeframe conditions are considered sequentially, and ultimately the lower timeframe waiting for pullbacks (i.e., mBDSR signals) is realized.They are compiled into these examples.
Additionally,many emphasize identifying points where multiple entry reasons overlap.There are many such cases.
In the explanations,over 1,000 chartsare used.

Methods and Case Studies (PDF) ★GogoJungle AWARD2020 Winner★
https://www.gogojungle.co.jp/tools/indicators/11836
The above products include 301 PDFs. For a list of their PDF titles and other details, please refer to the article below.
About the 301 PDF files included with “BODSOR・mBDSR”
https://www.gogojungle.co.jp/finance/navi/articles/34271
Euro/Australian Dollar 5-minute chart
If you look at the area circled with a white circle on the 5-minute chart above,a horizontal line that previously acted as resistancewas revisited downward,mBDSR (filter: RCI26 and RCI52) pullback-buy signalwas lit up and it rose sharply.
From this example,a trading method focused on resistance/ Support turning into resistance and supportandthe harmony with mBDSR signalscan be inferred.
Indicator that shines in combination with RCI:【BODSOR・mBDSR】
Methods and Case Studies (PDF) ★GogoJungle AWARD2020 Winner★
https://www.gogojungle.co.jp/tools/indicators/11836
The PDF files number 301 (over 1,000 pages in total, over 350,000 characters in total).
Many of them document examples where, by logically linking higher and lower timeframes using three RCI lines, multiple lower-timeframe conditions are considered sequentially, and ultimately the lower timeframe waiting for pullbacks (i.e., mBDSR signals) is realized.They are compiled into these examples.
Additionally,many emphasize identifying points where multiple entry reasons overlap.There are many such cases.
In the explanations,over 1,000 chartsare used.
× ![]()


