

【Capture the Bottom and Reversal!!】Sell signal on the pullback of the moving average, head-and-shoulders pattern, and mBDSR (RCI two-filter)
0
Indicator that captures the bottom/top reversal in combination with RCI【mBDSR】
Method and Case Study (PDF) ★GogoJungle AWARD2020 Winner★
https://www.gogojungle.co.jp/tools/indicators/11836
【Special Video】First Session (Includes viewing bonus special indicator)
https://www.gogojungle.co.jp/finance/navi/articles/70917
【Special Video】Second Session
https://www.gogojungle.co.jp/finance/navi/articles/71083
【Special Video】Third Session
https://www.gogojungle.co.jp/finance/navi/articles/71151
USD/JPY 5-minute chart
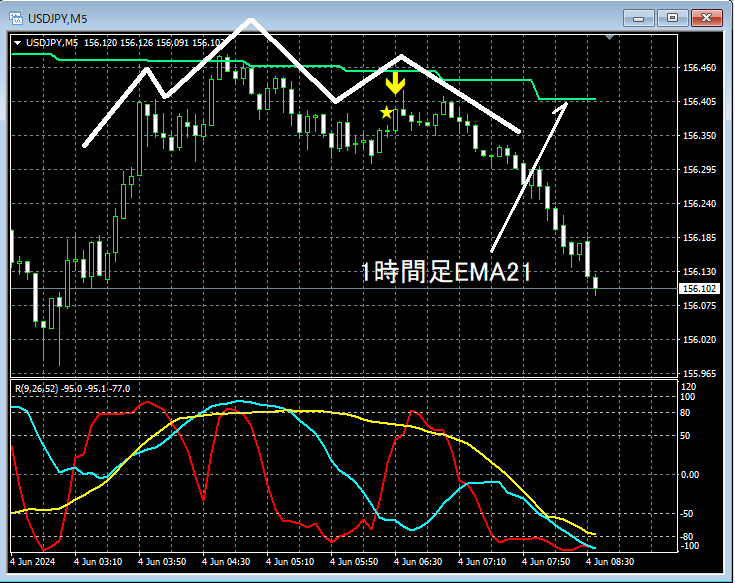
The chart of higher timeframes is omitted, but in a downtrend on the 1-hour chart, the chart is configured to aim for pullback selling in the lower five-minute timeframe, seeking a trend reversal from an uptrend to a downtrend.
If you monitor the progression of the chart1-hour EMA21acts as resistanceHead and Shouldersforming and indicating a decline from the reversal, leading to a large drop.Head and ShouldersWhile the right shoulder is forming,mBDSR (Filter: RCI26 and RCI52) Sell signalis lit.
From this example,a trading method focused on moving averages and head-and-shouldersandthe compatibility with mBDSR signalsappear to be highly synergistic.
Indicator that shines in combination with RCI【BODSOR・mBDSR】
Method and Case Study (PDF) ★GogoJungle AWARD2020 Winner★
https://www.gogojungle.co.jp/tools/indicators/11836
A PDF file contains 301 items (over 1,000 pages, over 350,000 characters).
4 Many of themare examples summarized by logically linking higher and lower timeframes using three RCI lines, and ultimately waiting for pullback buying or pullback selling in the lower timeframe (i.e., mBDSR signals).is what they illustrate.
Additionally,many focus on identifying points where multiple entry reasons overlap.There are many such cases.
In the explanations,more than 1,000 chartsare used.

Method and Case Study (PDF) ★GogoJungle AWARD2020 Winner★
https://www.gogojungle.co.jp/tools/indicators/11836
【Special Video】First Session (Includes viewing bonus special indicator)
https://www.gogojungle.co.jp/finance/navi/articles/70917
【Special Video】Second Session
https://www.gogojungle.co.jp/finance/navi/articles/71083
【Special Video】Third Session
https://www.gogojungle.co.jp/finance/navi/articles/71151
USD/JPY 5-minute chart
The chart of higher timeframes is omitted, but in a downtrend on the 1-hour chart, the chart is configured to aim for pullback selling in the lower five-minute timeframe, seeking a trend reversal from an uptrend to a downtrend.
If you monitor the progression of the chart1-hour EMA21acts as resistanceHead and Shouldersforming and indicating a decline from the reversal, leading to a large drop.Head and ShouldersWhile the right shoulder is forming,mBDSR (Filter: RCI26 and RCI52) Sell signalis lit.
From this example,a trading method focused on moving averages and head-and-shouldersandthe compatibility with mBDSR signalsappear to be highly synergistic.
Indicator that shines in combination with RCI【BODSOR・mBDSR】
Method and Case Study (PDF) ★GogoJungle AWARD2020 Winner★
https://www.gogojungle.co.jp/tools/indicators/11836
A PDF file contains 301 items (over 1,000 pages, over 350,000 characters).
4 Many of themare examples summarized by logically linking higher and lower timeframes using three RCI lines, and ultimately waiting for pullback buying or pullback selling in the lower timeframe (i.e., mBDSR signals).is what they illustrate.
Additionally,many focus on identifying points where multiple entry reasons overlap.There are many such cases.
In the explanations,more than 1,000 chartsare used.
× ![]()


