

[Capture the bottom of the market and reversal!] Counter-trend line, double top, and mbDSR (RCI two-filter) retracement sell signal
0
Indicator that captures “tops/bottoms and reversals” in combination with RCI【mBDSR】
Methods and Case Studies (PDF) ★GogoJungle AWARD2020 Recipient★
https://www.gogojungle.co.jp/tools/indicators/11836
【Special Video】 First Episode (Includes “Viewing Privilege Special Indicator”)
https://www.gogojungle.co.jp/finance/navi/articles/70917
【Special Video】 Second Episode
https://www.gogojungle.co.jp/finance/navi/articles/71083
【Special Video】 Third Episode
https://www.gogojungle.co.jp/finance/navi/articles/71151
USD/CHF 1-hour chart
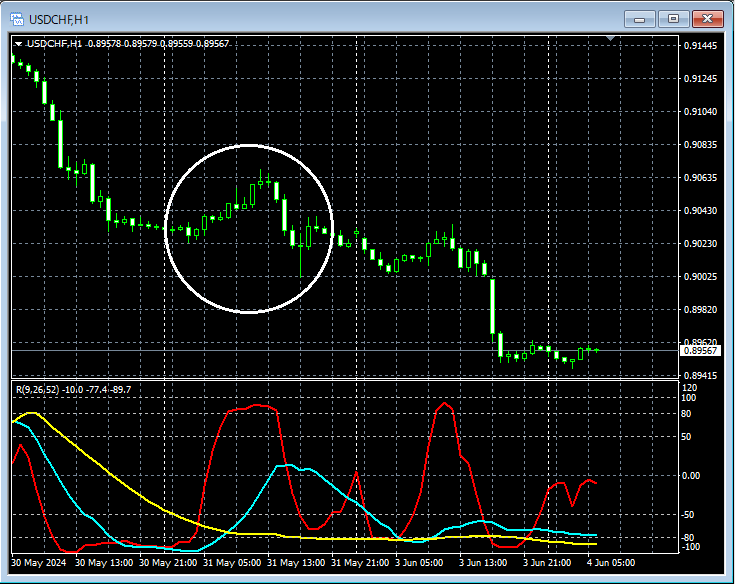
The higher-timeframe charts are omitted, but considering that the daily RCI is in a very weak shape, in the 1-hour timeframe above, around the area circled by a white circle there may be a setting where selling on rallies could be considered.
USD/CHF 5-minute chart
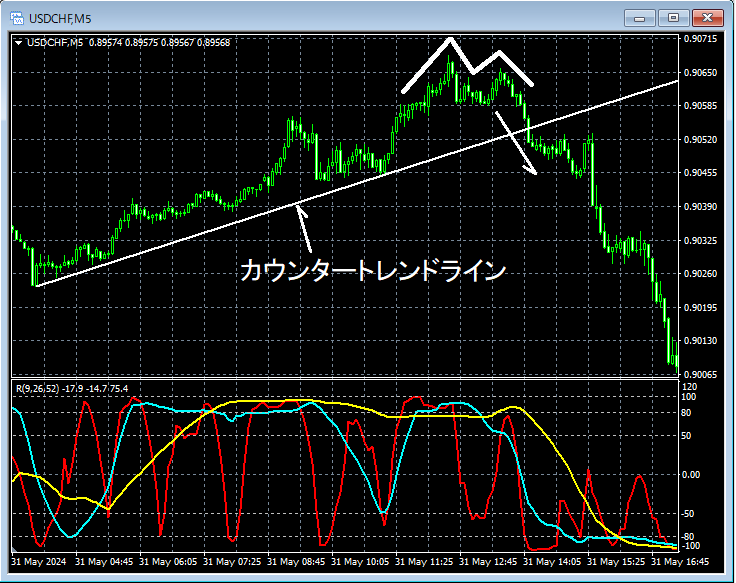
In the scene aiming at selling on rallies on the 1-hour chart, the above 5-minute chart is a chart aiming for a trend reversal from an uptrend to a downtrend.Double Topfollowed by a decline,Counter-trend Lineis broken below.Double Top FormationandCounter-trend Line Breakare chart patterns that suggest a trend reversal, and may increase the likelihood of a decline after a reversal, but here we proceed cautiously.Behavior after breaking below the Counter-trend Lineshall be observed a little further.
USD/CHF 5-minute chart
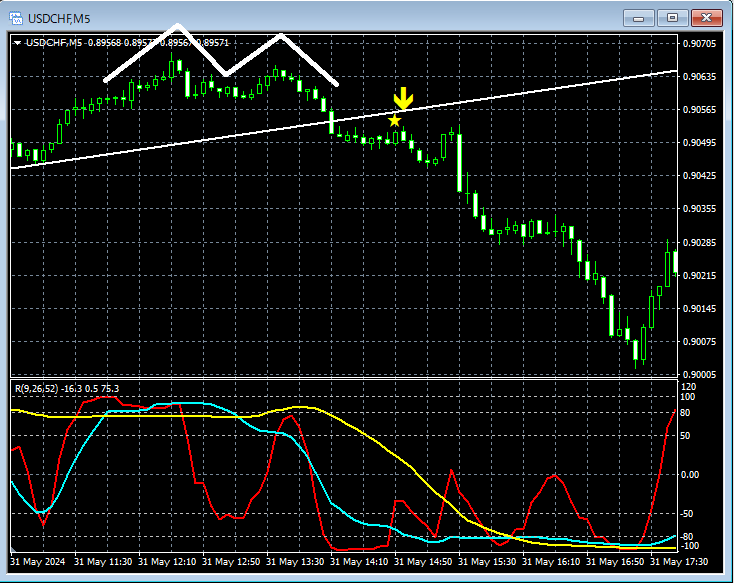
On the above 5-minute chart,Counter-trend Lineafter breaking below shows the chart's progressionmBDSR (Filter: RCI26 and RCI52) Sell-on-Rally signalslighting up as it declines.
In this case,Double Top FormationandCounter-trend Line BreakandmBDSR Sell-on-Rally signal activationoverlap, providing multiple entry reasons.
From this example,the synergy between a trading method focused on Double Tops and Counter-trend Linesandthe signals of mBDSRappears strong.
Indicator that shines in combination with RCI 【BODSOR・mBDSR】
Methods and Case Studies (PDF) ★GogoJungle AWARD2020 Recipient★
https://www.gogojungle.co.jp/tools/indicators/11836
The PDF file includes 301 items (over 1,000 pages, over 350,000 characters in total).
Many of them are designed as examples that logically link higher and lower timeframes using three RCI lines, systematically considering multiple lower-timeframe conditions and ultimately waiting for pullbacks or rallies in the lower timeframe (i.e., mBDSR signals).Additionally,
.
Descriptions use.”

Methods and Case Studies (PDF) ★GogoJungle AWARD2020 Recipient★
https://www.gogojungle.co.jp/tools/indicators/11836
【Special Video】 First Episode (Includes “Viewing Privilege Special Indicator”)
https://www.gogojungle.co.jp/finance/navi/articles/70917
【Special Video】 Second Episode
https://www.gogojungle.co.jp/finance/navi/articles/71083
【Special Video】 Third Episode
https://www.gogojungle.co.jp/finance/navi/articles/71151
USD/CHF 1-hour chart
The higher-timeframe charts are omitted, but considering that the daily RCI is in a very weak shape, in the 1-hour timeframe above, around the area circled by a white circle there may be a setting where selling on rallies could be considered.
USD/CHF 5-minute chart
In the scene aiming at selling on rallies on the 1-hour chart, the above 5-minute chart is a chart aiming for a trend reversal from an uptrend to a downtrend.Double Topfollowed by a decline,Counter-trend Lineis broken below.Double Top FormationandCounter-trend Line Breakare chart patterns that suggest a trend reversal, and may increase the likelihood of a decline after a reversal, but here we proceed cautiously.Behavior after breaking below the Counter-trend Lineshall be observed a little further.
USD/CHF 5-minute chart
On the above 5-minute chart,Counter-trend Lineafter breaking below shows the chart's progressionmBDSR (Filter: RCI26 and RCI52) Sell-on-Rally signalslighting up as it declines.
In this case,Double Top FormationandCounter-trend Line BreakandmBDSR Sell-on-Rally signal activationoverlap, providing multiple entry reasons.
From this example,the synergy between a trading method focused on Double Tops and Counter-trend Linesandthe signals of mBDSRappears strong.
Indicator that shines in combination with RCI 【BODSOR・mBDSR】
Methods and Case Studies (PDF) ★GogoJungle AWARD2020 Recipient★
https://www.gogojungle.co.jp/tools/indicators/11836
The PDF file includes 301 items (over 1,000 pages, over 350,000 characters in total).
Many of them are designed as examples that logically link higher and lower timeframes using three RCI lines, systematically considering multiple lower-timeframe conditions and ultimately waiting for pullbacks or rallies in the lower timeframe (i.e., mBDSR signals).Additionally,
.
Descriptions use.”
× ![]()


