

[Risk-reward favorable high-probability trade] Awareness of the horizontal line and the mBDSR (RCI two-line filter) pullback buy signal
Indicator that captures “tops/bottoms and reversals” in combination with RCI【mBDSR】
Methods & Case Studies (PDF) ★GogoJungle AWARD2020 winner★
https://www.gogojungle.co.jp/tools/indicators/11836
【Special Video】First Time (Includes viewing perks indicator)
https://www.gogojungle.co.jp/finance/navi/articles/70917
【Special Video】Second Time
https://www.gogojungle.co.jp/finance/navi/articles/71083
【Special Video】Third Time
https://www.gogojungle.co.jp/finance/navi/articles/71151
EURCAD 4-hour chart
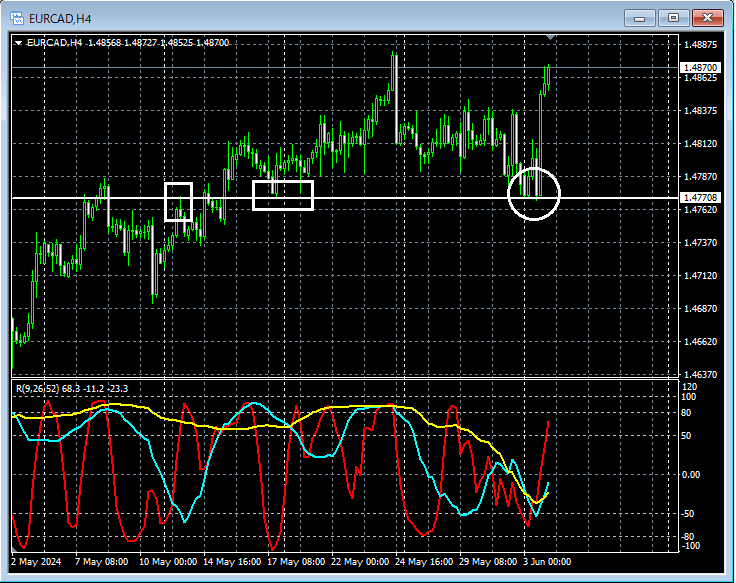
On the 4-hour chart above, at the area circled in whitethere are horizontal levels that have historically been treated as resistance or supportand it has fallen toward the vicinity, so it is not unreasonable to think that at least a rebound may occur for the time being.
EURCAD 1-minute chart
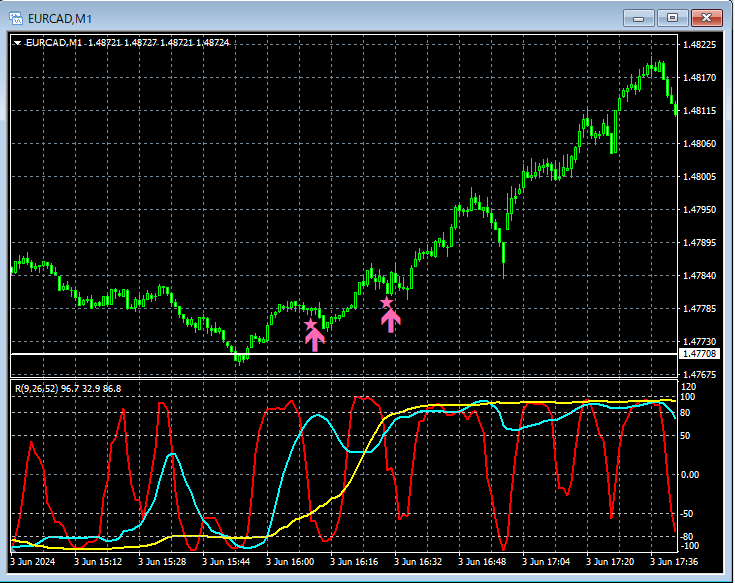
On the 1-minute chart abovethe horizontal level that is being watched as supportnear whichmBDSR (Filter: RCI26 and RCI52) pullback buy signallights up and rises sharply.
From this example,a trade method focused on horizontal linesandthe compatibility of mBDSR signalsare evident.
Also in this example, by placing the stop loss just below the most recent low,a high risk-reward, high-probability trade becomes possible.
Indicator that shines when combined with RCI【BODSOR・mBDSR】
Methods & Case Studies (PDF) ★GogoJungle AWARD2020 winner★
https://www.gogojungle.co.jp/tools/indicators/11836
PDF files are included: 301 files (over 1,000 pages total, over 350,000 characters).
Many of these are compiled as examples that logically link higher and lower timeframes using three RCI lines, gradually considering the status of multiple lower timeframes and ultimately waiting for pullbacks or retracements on the lower timeframe (i.e., mBDSR signals).Additionally,
The explanation uses

Methods & Case Studies (PDF) ★GogoJungle AWARD2020 winner★
https://www.gogojungle.co.jp/tools/indicators/11836
【Special Video】First Time (Includes viewing perks indicator)
https://www.gogojungle.co.jp/finance/navi/articles/70917
【Special Video】Second Time
https://www.gogojungle.co.jp/finance/navi/articles/71083
【Special Video】Third Time
https://www.gogojungle.co.jp/finance/navi/articles/71151
EURCAD 4-hour chart
On the 4-hour chart above, at the area circled in whitethere are horizontal levels that have historically been treated as resistance or supportand it has fallen toward the vicinity, so it is not unreasonable to think that at least a rebound may occur for the time being.
EURCAD 1-minute chart
On the 1-minute chart abovethe horizontal level that is being watched as supportnear whichmBDSR (Filter: RCI26 and RCI52) pullback buy signallights up and rises sharply.
From this example,a trade method focused on horizontal linesandthe compatibility of mBDSR signalsare evident.
Also in this example, by placing the stop loss just below the most recent low,a high risk-reward, high-probability trade becomes possible.
Indicator that shines when combined with RCI【BODSOR・mBDSR】
Methods & Case Studies (PDF) ★GogoJungle AWARD2020 winner★
https://www.gogojungle.co.jp/tools/indicators/11836
PDF files are included: 301 files (over 1,000 pages total, over 350,000 characters).
Many of these are compiled as examples that logically link higher and lower timeframes using three RCI lines, gradually considering the status of multiple lower timeframes and ultimately waiting for pullbacks or retracements on the lower timeframe (i.e., mBDSR signals).Additionally,
The explanation uses
× ![]()


