

[High Risk-Reward Advantageous Trade] Buy signal on dips using moving averages, double bottom, counter-trend line, and mBDSR (RCI 2 line filter)
0
Indicator that captures “tops and bottoms and reversals” in combination with RCI: 【mBDSR】
Methods, case studies (PDF) ★GogoJungle AWARD 2020 winner★
https://www.gogojungle.co.jp/tools/indicators/11836
【Special Video】 First time (Includes “Viewer Privilege Special Indicator”)
https://www.gogojungle.co.jp/finance/navi/articles/70917
【Special Video】 Second time
https://www.gogojungle.co.jp/finance/navi/articles/71083
【Special Video】 Third time
https://www.gogojungle.co.jp/finance/navi/articles/71151
NZDUSD 5-minute chart
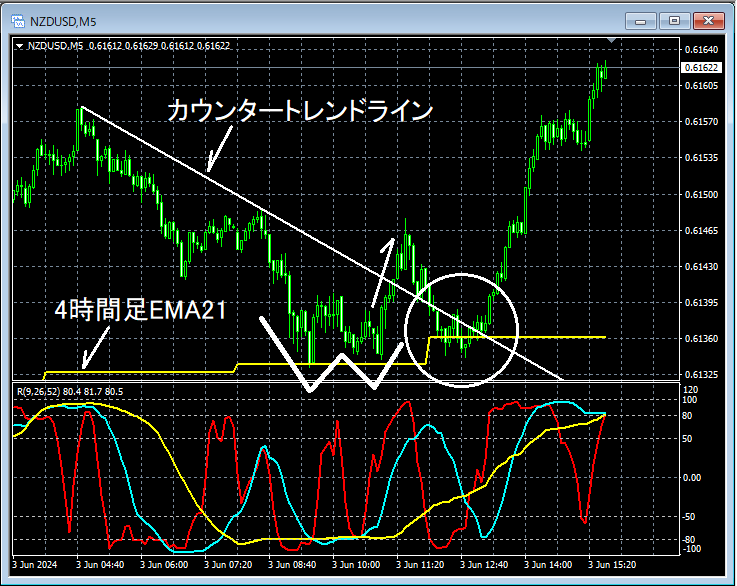
The situation of the higher time frame is omitted, butNear the 4-hour EMA21we will consider a rebound to the upside. On the upper 5-minute chart,Near the 4-hour EMA21there isa double bottomforming andbreaking above the counter-trend lineindicating that the potential for a rebound is increasing. Here, we will carefully observe the subsequent behavior (around the area circled with a white circle) on the lower time frame of 1 minute.
NZDUSD 1-minute chart
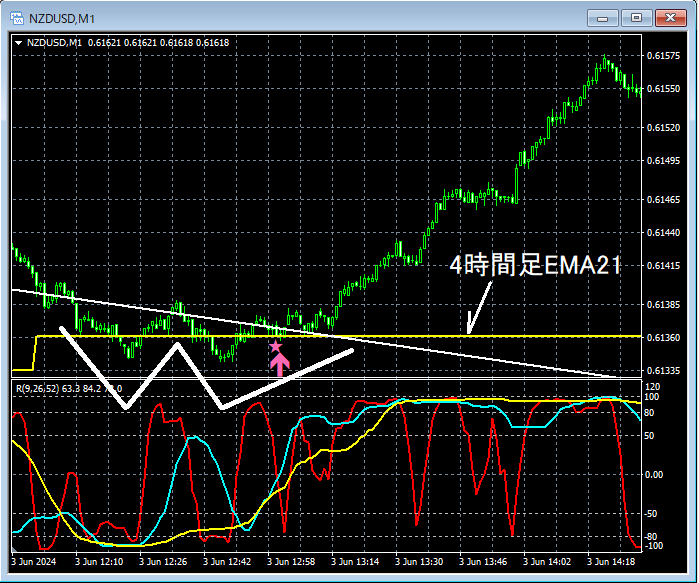
In the 1-minute chart above,Near the 4-hour EMA21it has fallen again andformed a double bottomand has risen. During the ascent from the right-hand trough of thedouble bottomthemBDSR (Filter: RCI26 and RCI52) pullback-buy signalis illuminated.
From this example,a trading approach focused on moving averages, double bottoms, and counter-trend lines as support, andthecompatibility with the mBDSR signalsis evident.
Additionally, in this example, placing the stop loss a little below the recent lowhelps create a high risk-reward favorable tradewith good potential.
Indicator that shines when used in combination with RCI: 【BODSOR・mBDSR】
Methods, case studies (PDF) ★GogoJungle AWARD 2020 winner★
https://www.gogojungle.co.jp/tools/indicators/11836
PDF files are included in 301 pieces (over 1,000 pages, over 350,000 characters in total).
Many of these are about linking higher and lower time frames logically using three RCI lines, and thoroughly examining the status of multiple lower time frames sequentially, ultimately waiting for pullbacks or retracements on the lower time frame (i.e., mBDSR signals).
Additionally,there are many that emphasize identifying points where multiple entry reasons overlap..
Explanation usesover 1,000 charts.

Methods, case studies (PDF) ★GogoJungle AWARD 2020 winner★
https://www.gogojungle.co.jp/tools/indicators/11836
【Special Video】 First time (Includes “Viewer Privilege Special Indicator”)
https://www.gogojungle.co.jp/finance/navi/articles/70917
【Special Video】 Second time
https://www.gogojungle.co.jp/finance/navi/articles/71083
【Special Video】 Third time
https://www.gogojungle.co.jp/finance/navi/articles/71151
NZDUSD 5-minute chart
The situation of the higher time frame is omitted, butNear the 4-hour EMA21we will consider a rebound to the upside. On the upper 5-minute chart,Near the 4-hour EMA21there isa double bottomforming andbreaking above the counter-trend lineindicating that the potential for a rebound is increasing. Here, we will carefully observe the subsequent behavior (around the area circled with a white circle) on the lower time frame of 1 minute.
NZDUSD 1-minute chart
In the 1-minute chart above,Near the 4-hour EMA21it has fallen again andformed a double bottomand has risen. During the ascent from the right-hand trough of thedouble bottomthemBDSR (Filter: RCI26 and RCI52) pullback-buy signalis illuminated.
From this example,a trading approach focused on moving averages, double bottoms, and counter-trend lines as support, andthecompatibility with the mBDSR signalsis evident.
Additionally, in this example, placing the stop loss a little below the recent lowhelps create a high risk-reward favorable tradewith good potential.
Indicator that shines when used in combination with RCI: 【BODSOR・mBDSR】
Methods, case studies (PDF) ★GogoJungle AWARD 2020 winner★
https://www.gogojungle.co.jp/tools/indicators/11836
PDF files are included in 301 pieces (over 1,000 pages, over 350,000 characters in total).
Many of these are about linking higher and lower time frames logically using three RCI lines, and thoroughly examining the status of multiple lower time frames sequentially, ultimately waiting for pullbacks or retracements on the lower time frame (i.e., mBDSR signals).
Additionally,there are many that emphasize identifying points where multiple entry reasons overlap..
Explanation usesover 1,000 charts.
× ![]()


