

[Risk-reward favorable high-probability trade] Rebound sell signal for the moving average that is being watched and mBDSR (RCI two-line filter)
Indicator for “capturing tops and bottoms” by combining with RCI: 【mBDSR】
Methods and Case Studies (PDF) ★GogoJungle AWARD2020 winner★
https://www.gogojungle.co.jp/tools/indicators/11836
【Special Video】 First session (Includes Special Indicator for Viewing)
https://www.gogojungle.co.jp/finance/navi/articles/70917
【Special Video】 Second session
https://www.gogojungle.co.jp/finance/navi/articles/71083
【Special Video】 Third session
https://www.gogojungle.co.jp/finance/navi/articles/71151
Gold XAUUSD 5-minute chart
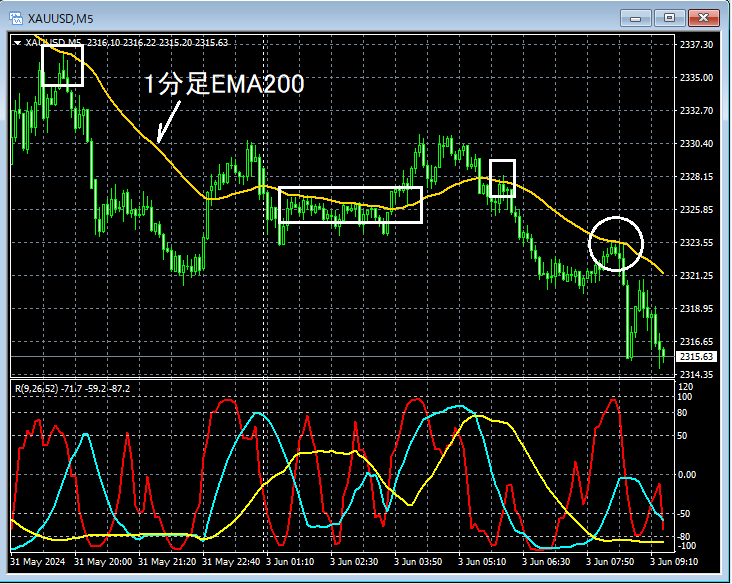
Looking at the area circled in white on the 5-minute chart above, it has acted as resistance and support several times in the past.1-minute EMA200has risen close to that area, making it not unusual to consider selling on a pullback on the lower timeframe.
Gold XAUUSD 1-minute chart
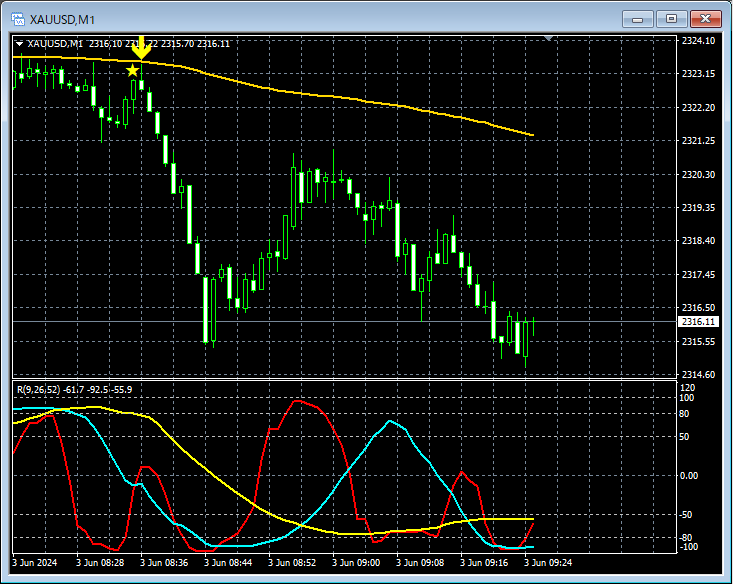
On the above 1-minute chart,1-minute EMA200rises to near that area, after whichmBDSR (Filter: RCI26 and RCI52) Sell signallights up and price declines.
From this example,a trading method focused on moving averages recognized as resistanceandthe harmony with mBDSR signalsis evident.
Additionally, in this example, by placing the stop just above the recent high,a high risk-reward favorable trade with good edgecan be achieved.
Indicator that shines in combination with RCI: 【BODSOR】 ・mBDSR
Methods and Case Studies (PDF) ★GogoJungle AWARD2020 winner★
https://www.gogojungle.co.jp/tools/indicators/11836
PDF files are attached in 301 items (over 1,000 pages, over 350,000 characters in total).
Most of them are examples that break down the situation on multiple lower timeframes by logically linking the higher and lower timeframes using three lines of RCI, and ultimately waiting for a pullback or a continuation timing on the lower timeframes (i.e., mBDSR signals).
In addition,many of them focus on capturing points where multiple entry reasons overlap..
The explanations useover 1,000 charts.

Methods and Case Studies (PDF) ★GogoJungle AWARD2020 winner★
https://www.gogojungle.co.jp/tools/indicators/11836
【Special Video】 First session (Includes Special Indicator for Viewing)
https://www.gogojungle.co.jp/finance/navi/articles/70917
【Special Video】 Second session
https://www.gogojungle.co.jp/finance/navi/articles/71083
【Special Video】 Third session
https://www.gogojungle.co.jp/finance/navi/articles/71151
Gold XAUUSD 5-minute chart
Looking at the area circled in white on the 5-minute chart above, it has acted as resistance and support several times in the past.1-minute EMA200has risen close to that area, making it not unusual to consider selling on a pullback on the lower timeframe.
Gold XAUUSD 1-minute chart
On the above 1-minute chart,1-minute EMA200rises to near that area, after whichmBDSR (Filter: RCI26 and RCI52) Sell signallights up and price declines.
From this example,a trading method focused on moving averages recognized as resistanceandthe harmony with mBDSR signalsis evident.
Additionally, in this example, by placing the stop just above the recent high,a high risk-reward favorable trade with good edgecan be achieved.
Indicator that shines in combination with RCI: 【BODSOR】 ・mBDSR
Methods and Case Studies (PDF) ★GogoJungle AWARD2020 winner★
https://www.gogojungle.co.jp/tools/indicators/11836
PDF files are attached in 301 items (over 1,000 pages, over 350,000 characters in total).
Most of them are examples that break down the situation on multiple lower timeframes by logically linking the higher and lower timeframes using three lines of RCI, and ultimately waiting for a pullback or a continuation timing on the lower timeframes (i.e., mBDSR signals).
In addition,many of them focus on capturing points where multiple entry reasons overlap..
The explanations useover 1,000 charts.
× ![]()


