

[Good risk-reward profitable edge trade] The pullback buy signal for moving averages, double bottoms, and mBDSR (RCI two-line filter) that are recognized as support
0
Indicator that captures “tops and bottoms and reversals” in combination with RCI: 【mBDSR】
Methods and Case Studies (PDF) ★GogoJungle AWARD 2020 Winner★
https://www.gogojungle.co.jp/tools/indicators/11836
【Special Video】First Session (Includes “Viewing Benefit Special Indicator”)
https://www.gogojungle.co.jp/finance/navi/articles/70917
【Special Video】Second Session
https://www.gogojungle.co.jp/finance/navi/articles/71083
【Special Video】Third Session
https://www.gogojungle.co.jp/finance/navi/articles/71151
USDCAD 4-hour Chart
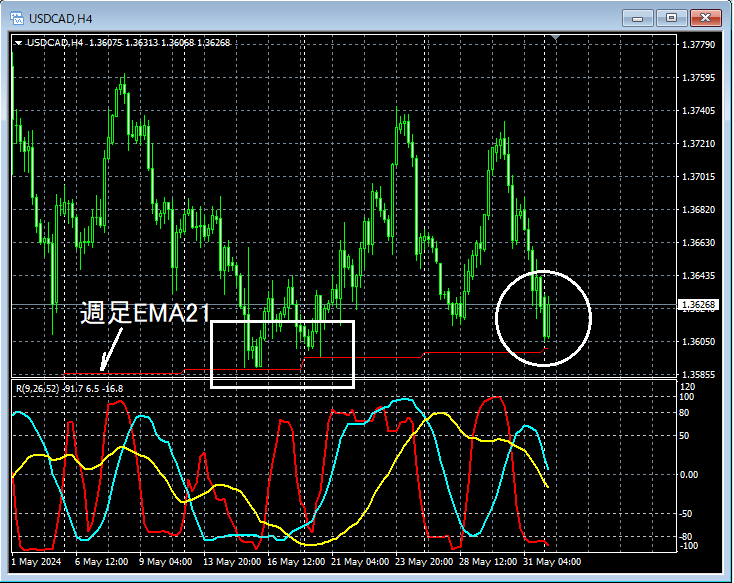
If you look around the area circled in white on the 4-hour chart above, it has functioned as support several times in the pastWeekly EMA21has fallen to nearby levels, and it might not be unusual to consider buying on dips on lower timeframes.
USDCAD 5-minute Chart
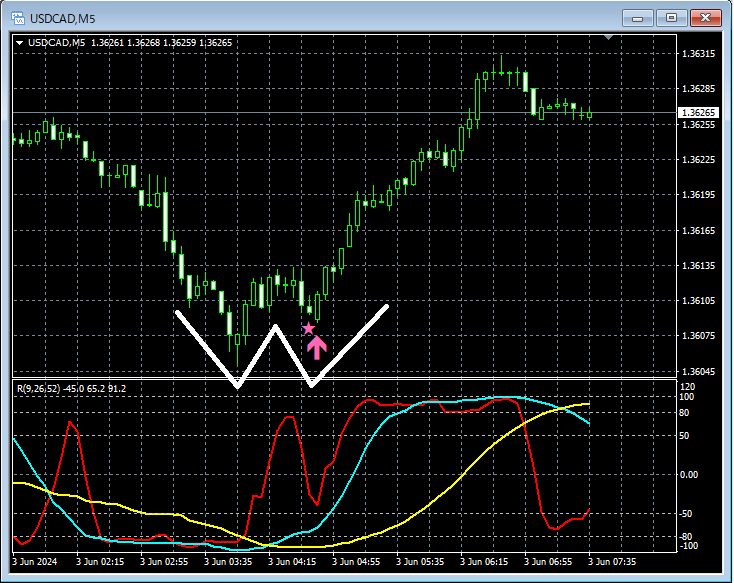
On the 5-minute chart aboveWeekly EMA21has fallen to near the area,Double Bottomformed and rose. TheDouble BottommBDSR (Filter: RCI26 and RCI52) Buy Signalis lit up.
From this example,the strategy focused on movements around moving averages and double bottoms that are treated as supportandthe signal of mBDSRshows strong compatibility.
Also, as in this example,the right-side valley of the double bottomiswhere the mBDSR (Filter: RCI26 and RCI52) Buy Signallights up; by placing the stop loss slightly belowthe left-side valley of the double bottomyou can achieve a high risk-reward favorable trade.
Indicator【BODSOR・mBDSR】that performs powerfully in combination with RCI
Methods and Case Studies (PDF) ★GogoJungle AWARD 2020 Winner★
https://www.gogojungle.co.jp/tools/indicators/11836
PDF files contain 301 items (over 1,000 pages, over 350,000 characters in total).
Many of them are detailed as examples that logically link higher and lower timeframes using three RCI lines to sequentially consider multiple lower-timeframe conditions and finally wait for entries on the lower timeframe (i.e., the mBDSR signal) such as dip buys or pullbacks.
Also,many focus on identifying points where multiple entry reasons overlap..
Explanation usesmore than 1,000 charts.

Methods and Case Studies (PDF) ★GogoJungle AWARD 2020 Winner★
https://www.gogojungle.co.jp/tools/indicators/11836
【Special Video】First Session (Includes “Viewing Benefit Special Indicator”)
https://www.gogojungle.co.jp/finance/navi/articles/70917
【Special Video】Second Session
https://www.gogojungle.co.jp/finance/navi/articles/71083
【Special Video】Third Session
https://www.gogojungle.co.jp/finance/navi/articles/71151
USDCAD 4-hour Chart
If you look around the area circled in white on the 4-hour chart above, it has functioned as support several times in the pastWeekly EMA21has fallen to nearby levels, and it might not be unusual to consider buying on dips on lower timeframes.
USDCAD 5-minute Chart
On the 5-minute chart aboveWeekly EMA21has fallen to near the area,Double Bottomformed and rose. TheDouble BottommBDSR (Filter: RCI26 and RCI52) Buy Signalis lit up.
From this example,the strategy focused on movements around moving averages and double bottoms that are treated as supportandthe signal of mBDSRshows strong compatibility.
Also, as in this example,the right-side valley of the double bottomiswhere the mBDSR (Filter: RCI26 and RCI52) Buy Signallights up; by placing the stop loss slightly belowthe left-side valley of the double bottomyou can achieve a high risk-reward favorable trade.
Indicator【BODSOR・mBDSR】that performs powerfully in combination with RCI
Methods and Case Studies (PDF) ★GogoJungle AWARD 2020 Winner★
https://www.gogojungle.co.jp/tools/indicators/11836
PDF files contain 301 items (over 1,000 pages, over 350,000 characters in total).
Many of them are detailed as examples that logically link higher and lower timeframes using three RCI lines to sequentially consider multiple lower-timeframe conditions and finally wait for entries on the lower timeframe (i.e., the mBDSR signal) such as dip buys or pullbacks.
Also,many focus on identifying points where multiple entry reasons overlap..
Explanation usesmore than 1,000 charts.
× ![]()


