

【Capture the Top and Bottom Reversals!!】Previous day's high and mBDSR (RCI two-clip filter) short-signal
0
Indicator that captures “tops-bottoms and reversals” in combination with RCI【mBDSR】
Methods, case studies (PDF) ★GogoJungle AWARD2020 winner★
https://www.gogojungle.co.jp/tools/indicators/11836
【Special Video】第一回(Includes exclusive viewing bonus indicator)
https://www.gogojungle.co.jp/finance/navi/articles/70917
【Special Video】Second Round
https://www.gogojungle.co.jp/finance/navi/articles/71083
【Special Video】Third Round
https://www.gogojungle.co.jp/finance/navi/articles/71151
USD/JPY 5-minute chart
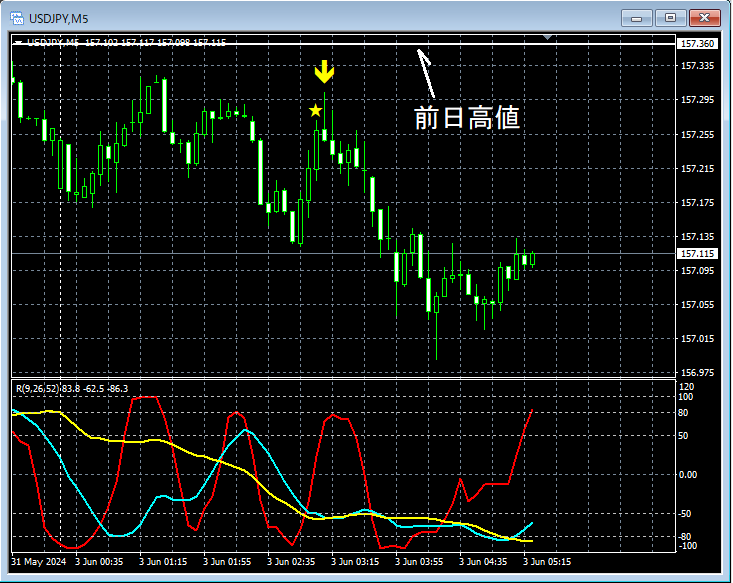
On the 5-minute chart abovePrevious day's highapproaches,mBDSR (filter: RCI26 and RCI52) pullback selling signallights up and the price declines.
From this example,a trading method focused on the previous day’s highandthe harmony with mBDSR signalsis evident.
Indicator that shines in combination with RCI: 【BODSOR・mBDSR】
Methods, case studies (PDF) ★GogoJungle AWARD2020 winner★
https://www.gogojungle.co.jp/tools/indicators/11836
PDF files are attached in 301 items (over 1,000 pages, over 350,000 characters in total).
Many of them aresummaries of cases where multiple timeframes are logically linked using three RCI lines, to sequentially analyze the status of several lower timeframes, ultimately waiting for the timing of buy-the-dull (pullback) or pullback selling on the lower timeframes (i.e., mBDSR signals).
Additionally,many focus on identifying points where multiple entry reasons converge.
In the explanations,over 1,000 chartsare used.

Methods, case studies (PDF) ★GogoJungle AWARD2020 winner★
https://www.gogojungle.co.jp/tools/indicators/11836
【Special Video】第一回(Includes exclusive viewing bonus indicator)
https://www.gogojungle.co.jp/finance/navi/articles/70917
【Special Video】Second Round
https://www.gogojungle.co.jp/finance/navi/articles/71083
【Special Video】Third Round
https://www.gogojungle.co.jp/finance/navi/articles/71151
USD/JPY 5-minute chart
On the 5-minute chart abovePrevious day's highapproaches,mBDSR (filter: RCI26 and RCI52) pullback selling signallights up and the price declines.
From this example,a trading method focused on the previous day’s highandthe harmony with mBDSR signalsis evident.
Indicator that shines in combination with RCI: 【BODSOR・mBDSR】
Methods, case studies (PDF) ★GogoJungle AWARD2020 winner★
https://www.gogojungle.co.jp/tools/indicators/11836
PDF files are attached in 301 items (over 1,000 pages, over 350,000 characters in total).
Many of them aresummaries of cases where multiple timeframes are logically linked using three RCI lines, to sequentially analyze the status of several lower timeframes, ultimately waiting for the timing of buy-the-dull (pullback) or pullback selling on the lower timeframes (i.e., mBDSR signals).
Additionally,many focus on identifying points where multiple entry reasons converge.
In the explanations,over 1,000 chartsare used.
× ![]()


