

【Capture the Sky and Inversion!!】Previous high on higher timeframe and the return sell signal with mBDSR (RCI two-filter)
0
Indicator that captures “tops/bottoms and reversals” in combination with RCI【mBDSR】
Methods, case studies (PDF) ★GogoJungle AWARD2020 winner★
https://www.gogojungle.co.jp/tools/indicators/11836
【Special Video】First edition (with special viewing bonus indicator)
https://www.gogojungle.co.jp/finance/navi/articles/70917
【Special Video】Second edition
https://www.gogojungle.co.jp/finance/navi/articles/71083
【Special Video】Third edition
https://www.gogojungle.co.jp/finance/navi/articles/71151
Pound/ODJ 4-hour chart
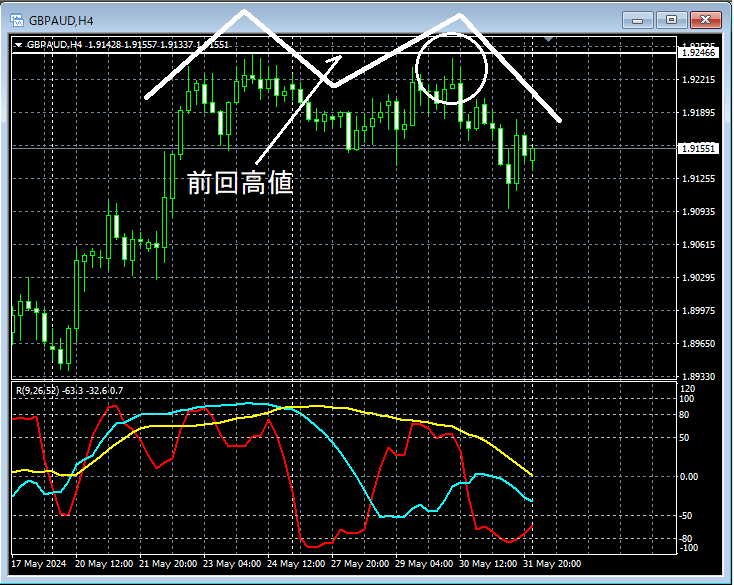
Looking at the area encircled by a white circle on the 4-hour chart abovePrevious highhas been approached upwards, and until the horizontal line is clearly broken to the upside, it may not be unusual to consider selling on rallies on lower timeframes. If it drops from here,a double topcould lead to a significant decline.
Pound/Australian dollar 5-minute chart
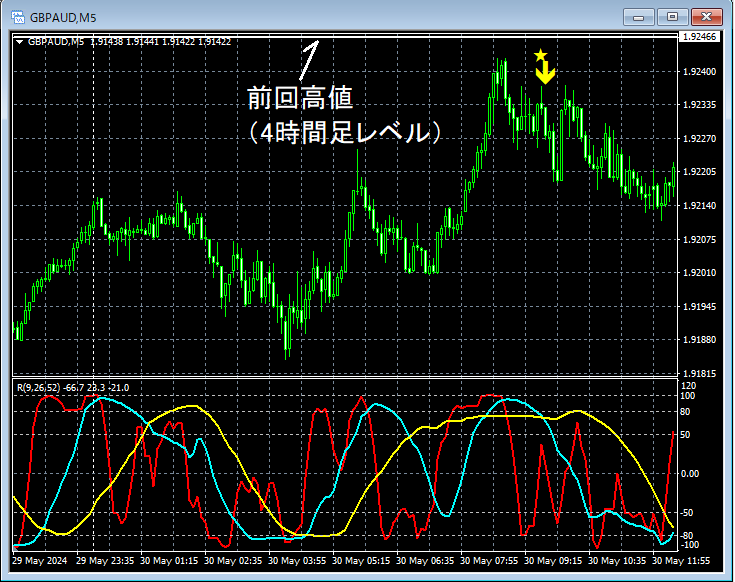
In the above 5-minute chart,the previous high on the 4-hour levelis approached after rising,mBDSR (filter: RCI26 and RCI52) sell signallights up and declines.
From this example,a trading method that focuses on horizontal lines and double tops likely to act as resistanceandthe signals of mBDSRshow a high degree of compatibility.
Indicator that shines in combination with RCI【BODSOR・mBDSR】
Methods, case studies (PDF) ★GogoJungle AWARD2020 winner★
https://www.gogojungle.co.jp/tools/indicators/11836
The PDF file includes 301 files (over 1,000 pages, over 350,000 characters in total).
Many of them consist of examples that logically link higher and lower timeframes using the RCI three-line setup, gradually examining multiple lower-timeframe conditions and eventually waiting for the timing to buy on dips or sell on rallies on the lower timeframe (i.e., mBDSR signals).
Additionally,many focus on identifying points where multiple entry reasons overlap.Also,
Explanation usesover 1,000 charts.

Methods, case studies (PDF) ★GogoJungle AWARD2020 winner★
https://www.gogojungle.co.jp/tools/indicators/11836
【Special Video】First edition (with special viewing bonus indicator)
https://www.gogojungle.co.jp/finance/navi/articles/70917
【Special Video】Second edition
https://www.gogojungle.co.jp/finance/navi/articles/71083
【Special Video】Third edition
https://www.gogojungle.co.jp/finance/navi/articles/71151
Pound/ODJ 4-hour chart
Looking at the area encircled by a white circle on the 4-hour chart abovePrevious highhas been approached upwards, and until the horizontal line is clearly broken to the upside, it may not be unusual to consider selling on rallies on lower timeframes. If it drops from here,a double topcould lead to a significant decline.
Pound/Australian dollar 5-minute chart
In the above 5-minute chart,the previous high on the 4-hour levelis approached after rising,mBDSR (filter: RCI26 and RCI52) sell signallights up and declines.
From this example,a trading method that focuses on horizontal lines and double tops likely to act as resistanceandthe signals of mBDSRshow a high degree of compatibility.
Indicator that shines in combination with RCI【BODSOR・mBDSR】
Methods, case studies (PDF) ★GogoJungle AWARD2020 winner★
https://www.gogojungle.co.jp/tools/indicators/11836
The PDF file includes 301 files (over 1,000 pages, over 350,000 characters in total).
Many of them consist of examples that logically link higher and lower timeframes using the RCI three-line setup, gradually examining multiple lower-timeframe conditions and eventually waiting for the timing to buy on dips or sell on rallies on the lower timeframe (i.e., mBDSR signals).
Additionally,many focus on identifying points where multiple entry reasons overlap.Also,
Explanation usesover 1,000 charts.
× ![]()


