

mBDSR (RCI2 band-pass filter) signal: aware of higher and lower timeframe
【Special Video】 Episode 1
https://www.gogojungle.co.jp/finance/navi/articles/70917
【Special Video】 Episode 2
https://www.gogojungle.co.jp/finance/navi/articles/71083
【Special Video】 Episode 3
https://www.gogojungle.co.jp/finance/navi/articles/71151
Pound/Swiss 1-hour chart
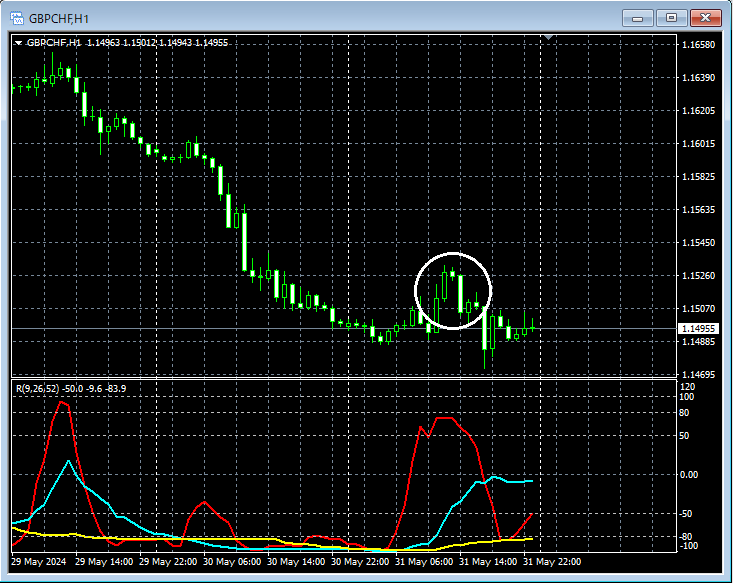
Looking at the 1-hour chart above where the area circled in white is, it is a chart pattern suggesting a reversal decline in a movement where the price is attempting a rebound in the midst of a strong downward move.Evening Star (Sakata's Five Methods)(a near form) appears, and considering that it may have already formed a rebound high, it might not be strange to consider selling on rallies on a lower time frame.
Pound/Swiss 5-minute chart
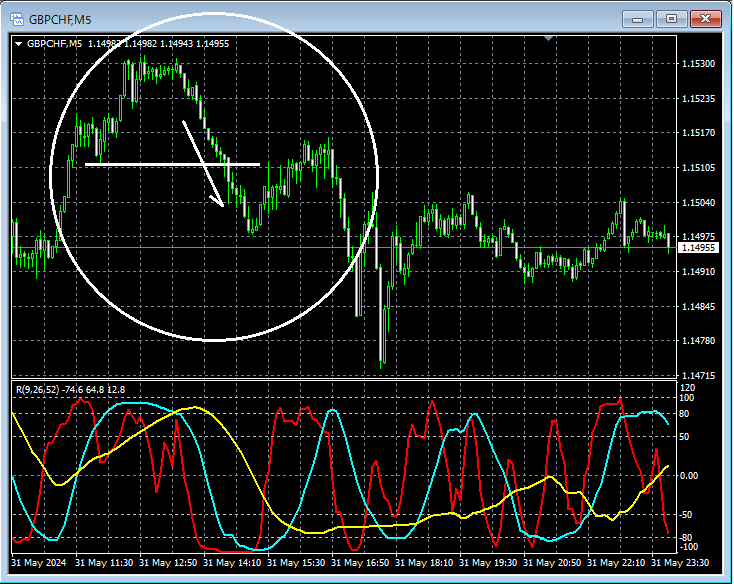
Looking at the area circled in white on the 5-minute chart above,the bullish swing lowbeing breached has at least temporarily negated the upward trend on the 5-minute chart, making selling on rallies a reasonable consideration in this situation.
Pound/Dollar 15-minute chart
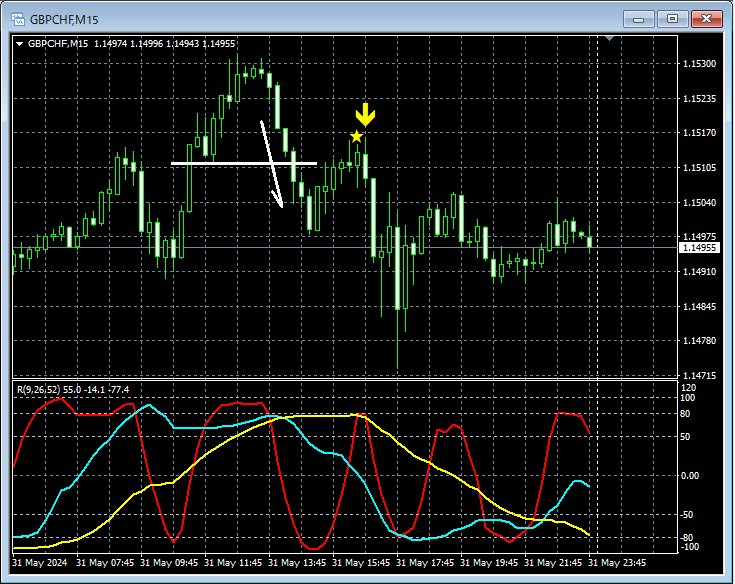
Looking at the 15-minute chart above, after the lower time frame (5-minute)pullback lowwas breached and rose again,mBDSR (Filter: RCI26 and RCI52) pullback/sell signallighted up and continued to fall.
From this example,evening star (Sakata's Five Methods) and Dow Theory-focused trading methodandthe compatibility with mBDSR signalsappear to be high.
Indicator that shines in combination with RCI: 【BODSOR・mBDSR】
and its technique & case studies (PDF) ★GogoJungle AWARD2020 winner★
https://www.gogojungle.co.jp/tools/indicators/11836
The PDF file contains 301 items (over 1,000 pages in total, over 350,000 characters).
Most of them areexamples that break down into waiting for pullback entries (i.e., mBDSR signals) on lower time frames by logically linking higher and lower time frames using the three RCI lines..
Also,many of them focus on capturing points where multiple entry reasons overlap..
The explanation usesover 1,000 charts..

× ![]()


