

Consider the response on the lower time frame after the signal on the higher time frame mBDSR (RCI with 2-filter) appears
0
In recent Investment Navigator+ articles,the high compatibility between various trading methods and mbDSR signals is shownwith numerous examples.
AUDJPY 1-hour chart
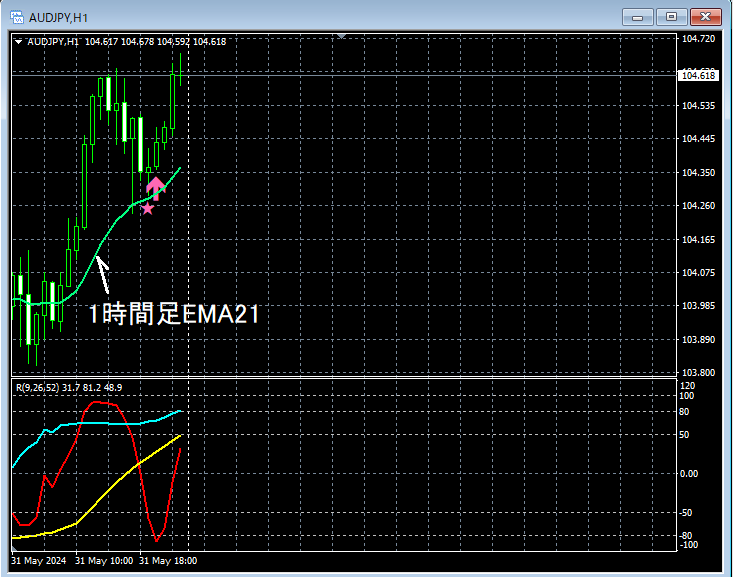
Looking at the 1-hour chart abovenear the 1-hour EMA21there isan mbDSR pullback-buy signal (filter: RCI26 and RCI52)illuminated. We will check if there is a pullback-buy timing on the lower timeframe.
AUDJPY 5-minute chart
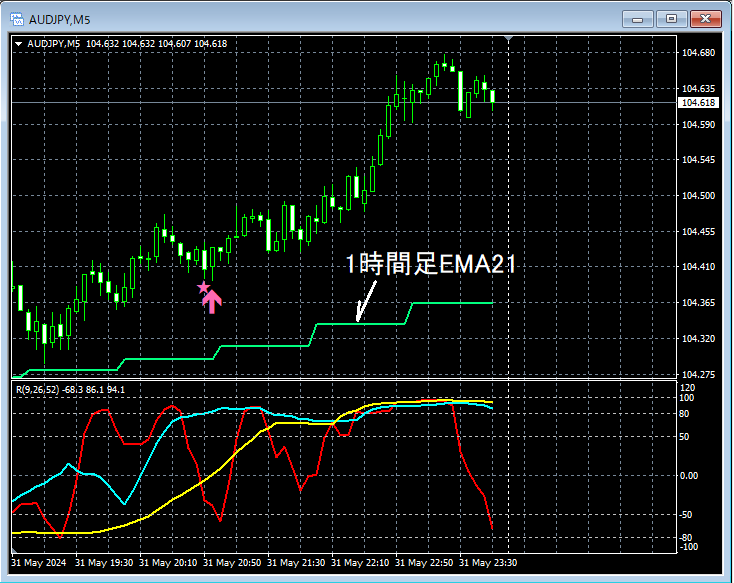
Looking at the 5-minute chart abovenear the 1-hour EMA21after a rebound, on the 5-minute chart as wellmbDSR pullback-buy signal (filter: RCI26 and RCI52)lights up and it rises further.
From this example,the high compatibility between moving-average-based trading methodsandmbDSR signalsis evident.
Indicators that shine when combined with RCI【BODSOR・mbDSR】
and the method/case studies (PDF) ★GogoJungle AWARD2020 Winner★
https://www.gogojungle.co.jp/tools/indicators/11836
The PDF file is included with 301 documents (over 1,000 pages total, over 350,000 words).
Many of them aresummaries that logically link higher and lower timeframes using three RCI lines, examining multiple lower-timeframe conditions step by step, and ultimately waiting for pullback-buy or pullback-sell timing on the lower timeframes (i.e., mbDSR signals).This is what they are about.
Also,many focus on capturing points where multiple entry rationales coincide..
In the explanations,more than 1,000 chartsare used.

× ![]()


