

大众心理: Pin Bar, 2B Reversal, and mBDSR (RCI2 filter with 2 lines) Sell signal (2)
In recent Investment Navi+ articles,the high harmony between various trading methods and mbDSR signalsis demonstrated through numerous examples.
GBP/USD 15-minute chart
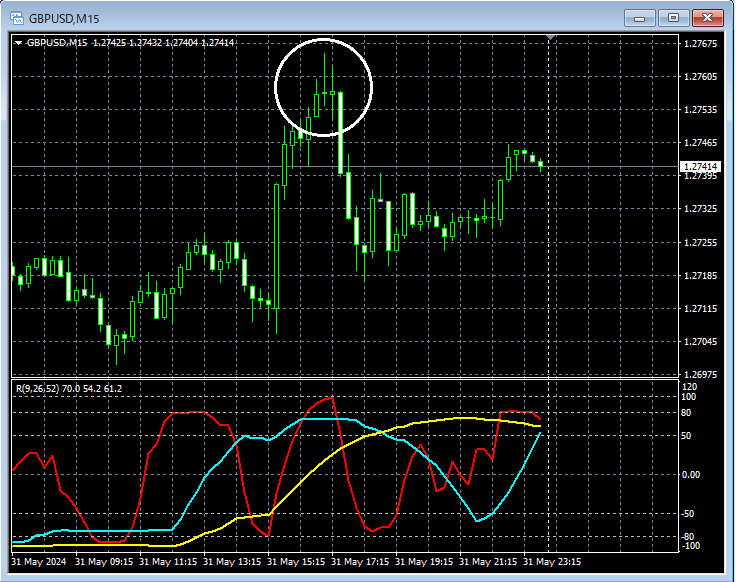
Looking at the area encircled in white on the 15-minute chart above, a pin bar (a candlestick with a long upper shadow) appears, which may be a scene where selling on rallies on lower timeframes is not unreasonable. In this case thepin barpin barsignals a pattern where traders who jumped in during a strong up move may get trapped. The crowd psychology may be interpreted as turning downward (bearish).
GBP/USD 5-minute chart
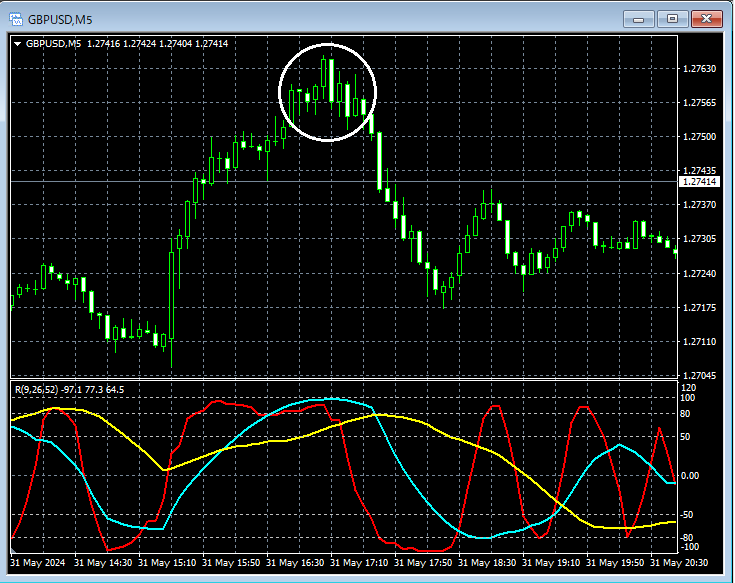
Looking at the area encircled in white on the 5-minute chart above, a2B reversalappears, which may be a scene where selling on rallies on lower timeframes is not unreasonable. In this case the2B reversalis a pattern where traders who jumped in during a strong up move get trapped. The crowd psychology may be interpreted as turning downward (bearish).
GBP/USD 1-minute chart
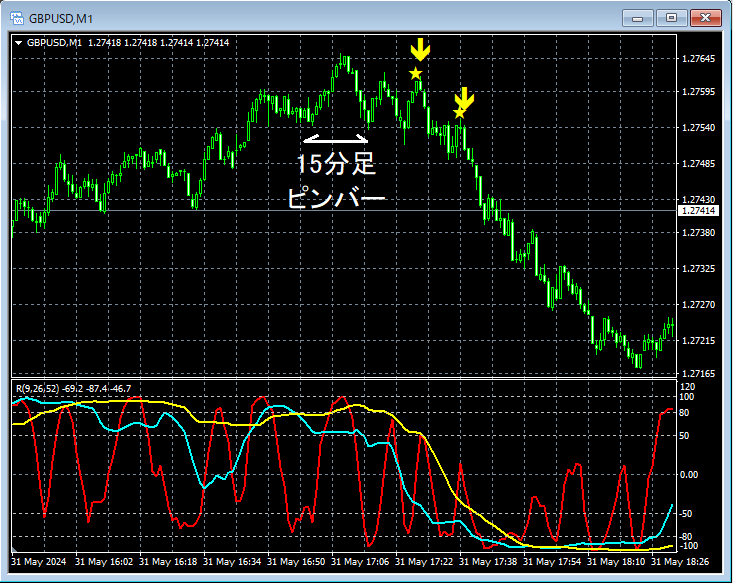
On the 1-minute chart above, together with the appearance of apin baron the 15-minute chart, there is a decline followed by a rebound andmbDSR (filter: RCI26 and RCI52) buyback/sell signallighting up and continuing to fall.
From this example,a trading method focusing on pin bars and 2B reversals (trading focused on crowd psychology)andmbDSR signalsshow a high degree of compatibility.
Indicators that excel in combination with RCI: 【BODSOR・mbDSR】
and methodologies / case studies (PDF) ★GogoJungle AWARD 2020 Winner★
https://www.gogojungle.co.jp/tools/indicators/11836
The PDF file includes 301 files (over 1,000 pages, over 350,000 characters in total).
Many of these areexamples that logically link the higher and lower timeframes using three RCI lines to consider multiple lower-timeframe situations sequentially, ultimately waiting for a timely pullback or a rise on the lower timeframes (i.e., mbDSR signals)..
Also,many focus on identifying points where multiple entry reasons overlap..
The explanations useover 1,000 charts.

× ![]()


