

Public psychology: Pin bar, 2B reversal, and mBDSR (RCI2 double filter) selling signal (1)
In recent articles on Investment Navigator Plus,the high compatibility between various trading methods and mBDSR signalsis demonstrated through numerous examples.
XAUUSD Gold 15-minute chart
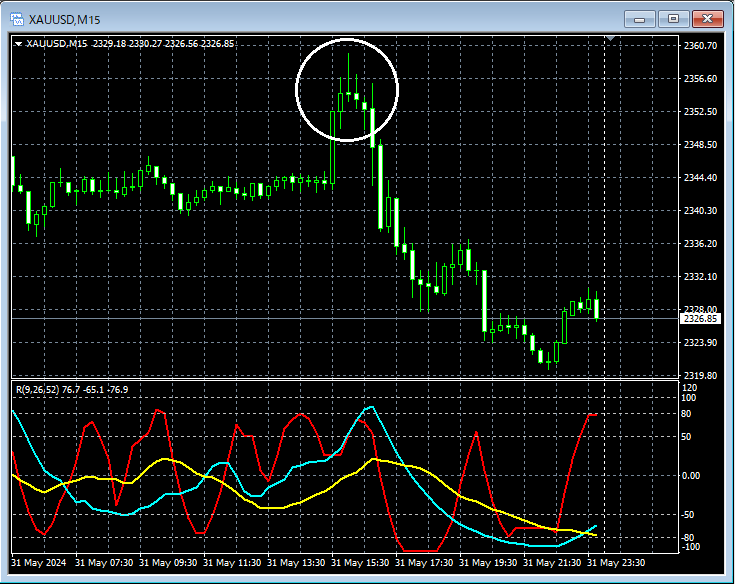
Looking at the area circled in white on the 15-minute chart above, it suggests a declinepin bar (a candle with a long upper shadow) has appeared, and it might not be unreasonable to consider selling on retracements on a lower time frame. In this case, thepin bar is a pattern where traders who jumped in during a strong rise get trapped. Public sentiment can be interpreted as turning downward (bearish).
XAUUSD Gold 5-minute chart
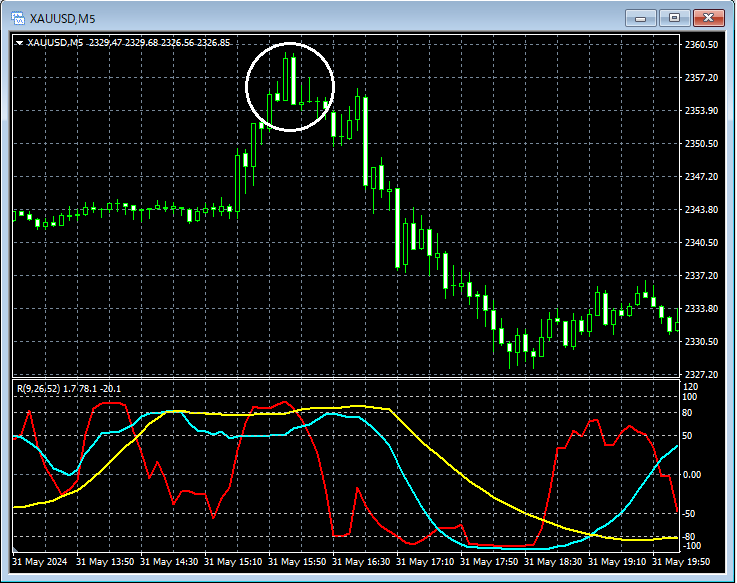
Looking at the area circled in white on the 5-minute chart above, it suggests a decline2B reversal has appeared, and it might not be unreasonable to consider selling on retracements on a lower time frame. In this case, the2B reversal is a pattern where traders who jumped in during a strong rise get trapped. Public sentiment can be interpreted as turning downward (bearish).
XAUUSD Gold 1-minute chart
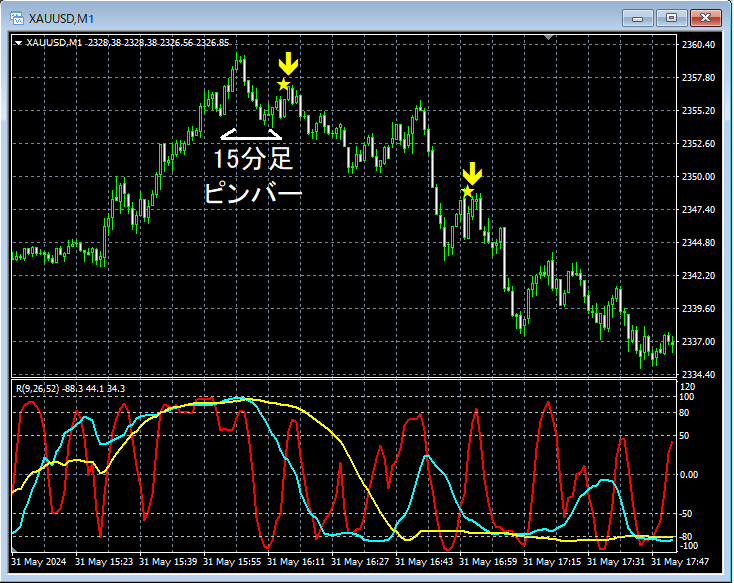
On the 1-minute chart above, together with the appearance ofpin bar on the 15-minute chart, the subsequent rise after a declinemBDSR (filter: RCI26 and RCI52) retrace sell signal lights up and the price continues to fall.
From this example,a trading method focusing on pin bars and 2B reversals (trading method focusing on crowd psychology) andmBDSR signals show a high degree of harmony.
Indicators that excel when combined with RCI: [BODSOR・mBDSR]
and strategies/case studies (PDF) ★GogoJungle AWARD 2020 winner★
https://www.gogojungle.co.jp/tools/indicators/11836
The PDF file includes 301 items (over 1,000 pages, over 350,000 characters total).
Many of them are compiled to show how to logically link higher and lower time frames using three RCI lines, sequentially analyze the conditions of multiple lower time frames, and ultimately wait for the timing to buy on dips or sell on retracements on the lower time frames (i.e., mBDSR signals).
Additionally,many focus on capturing points where multiple entry reasons coincide..
The explanations useover 1,000 charts.

× ![]()


