

Public Psychology: The chart shows the rising buy signal from the horizontal line and pin bar and mBDSR (RCI two-band filter) oversold/press-buy signal
0
In recent Investment Navigator+ articles,the high compatibility between various trading methods and mBDSR signalsis illustrated with numerous examples.
NZDJPY Daily
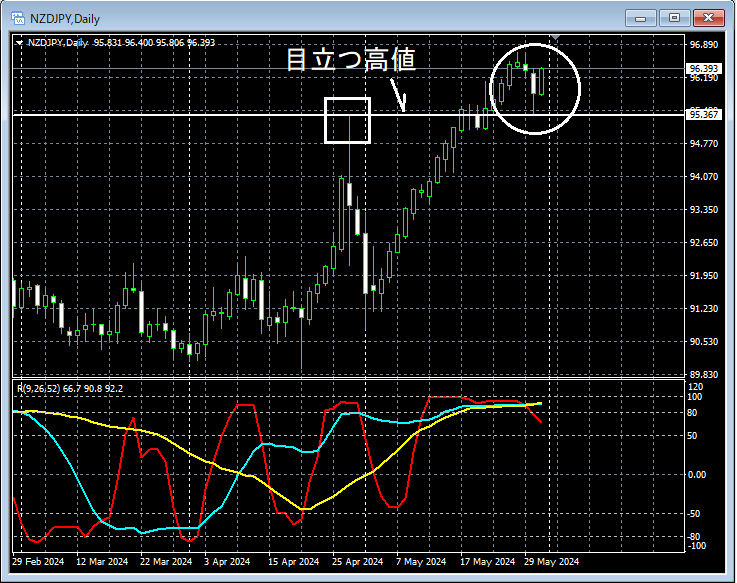
If you look at the area encircled in white on the above daily chart,the horizontal line that serves as a support level on the chart (notable high)is near,a potential reversal from supportand a rise is conceivable.
NZDJPY 4-hour
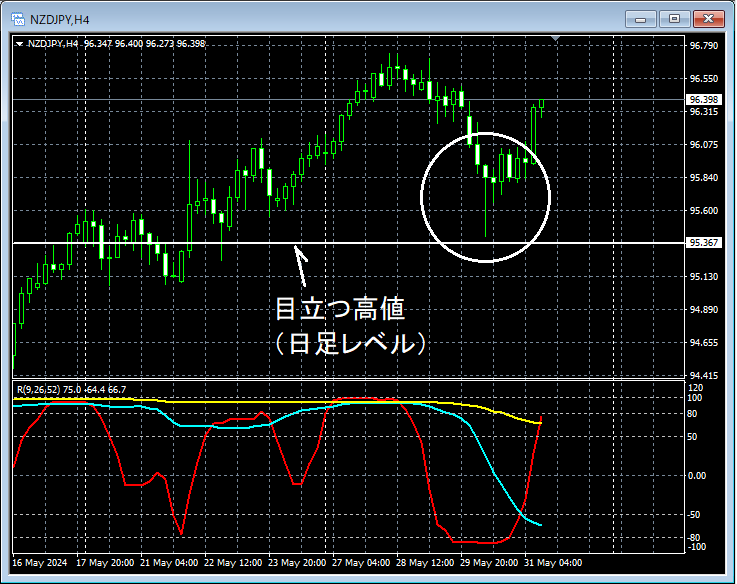
If you look at the area encircled in white on the upper 4-hour chart,the horizontal line that the chart regards as a support line (notable high on the daily level)is approached after a drop, suggesting a risePin Bar(a candlestick with a long lower wick) appears, and until thishorizontal lineis clearly broken to the downside, it may not be unusual to consider buying on dips on the lower timeframes. In this case, thePin Baris a pattern where traders who jumped in during a strong drop get trapped. Public sentiment is interpreted as turning upward (bullish).
NZDJPY 1-hour
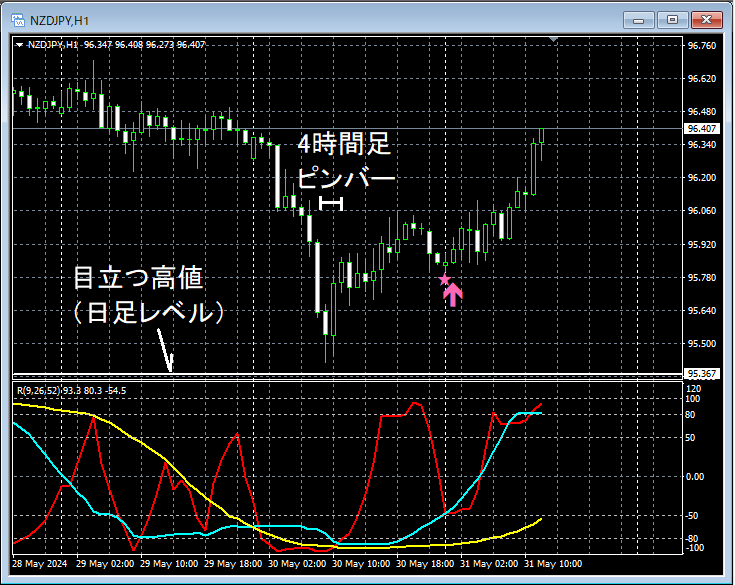
On the 1-hour chart above, together with the emergence of thePin Baron the 4-hour chart, after the decline that followed the risemBDSR (Filter: RCI26 and RCI52) Buy-the-dip signallights up and continues to rise.
From this example,a trading method that focuses on pin bars and horizontal lines that are watched on the chart (a method focusing on crowd psychology)andmBDSR signalsshow a high degree of compatibility.
Indicators that shine when combined with RCI: [BODSOR・mBDSR]
and their methods & case studies (PDF) ★GogoJungle AWARD2020 Winner★
https://www.gogojungle.co.jp/tools/indicators/11836
The PDF file contains 301 documents (over 1,000 pages in total, over 350,000 characters).
Many of them are:examples that outline how to logically link higher and lower timeframes using three RCI lines, then progressively analyze multiple lower timeframes and ultimately wait for buy-the-dip or sell-the-rally timing on the lower timeframes (i.e., mBDSR signals)..
Also,many focus on identifying points where multiple entry reasons overlap..
The explanations useover 1,000 charts.

× ![]()


