

[Mass Psychology] A bullish signal on the rebound at the support line and pin bar, as well as the mBDSR (RCI two-band filter) indicating a buy signal
0
In the latest Investment Navigator+ article,you can see the high compatibility between various trading methods and mBDSR signalsthrough many examples.
AUDJPY 4-hour chart
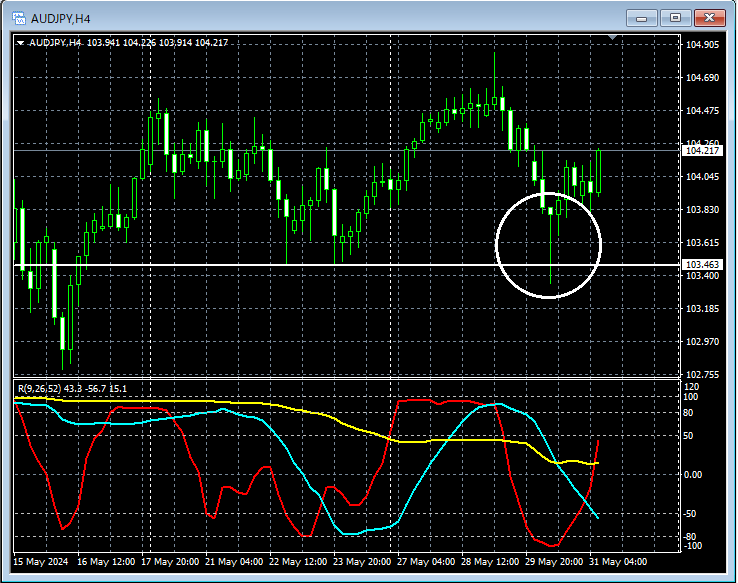
If you look at the area encircled in white on the 4-hour chart above,the horizontal line that is treated as a support line on the chartis likely to hint at further downside before turning upPin Bar(a candlestick with a long lower shadow)appears, and thishorizontal lineis something you might consider buying on a pullback on lower timeframes until it decisively breaks below. In this case, thePin Baris a pattern where traders who jumped in during a strong drop get caught. Market sentiment is interpreted as turning upward (bullish) in some interpretations.
AUDJPY 30-minute chart
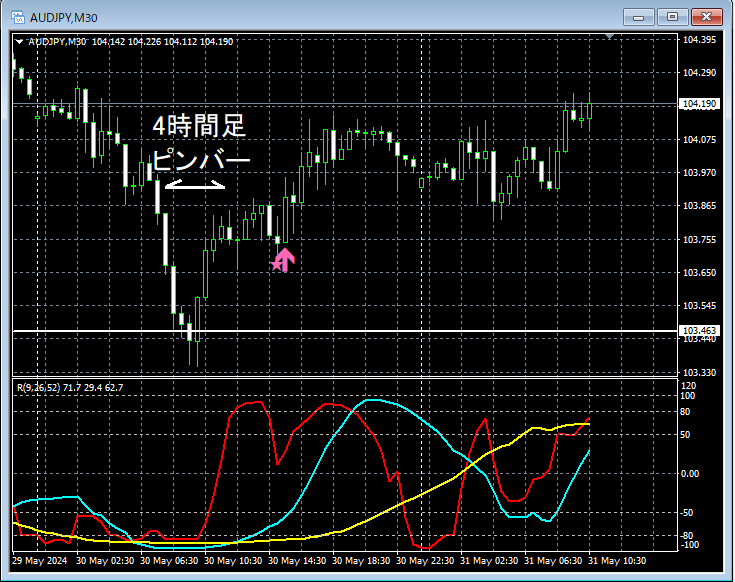
On the 30-minute chart above, after the appearance of thePin Baron the 4-hour chart, the subsequent pullback showsmBDSR (filter: RCI26 and RCI52) pullback buy signallighting up and continuing to rise.
From this example,a trading method that focuses on Pin Bars and horizontally significant levels on the chart (trading method focusing on crowd psychology)andthe signals of mBDSR
Indicator that shines in combination with RCI: 【BODSOR・mBDSR】
and methodology/case studies (PDF) ★GogoJungle AWARD 2020 winner★
https://www.gogojungle.co.jp/tools/indicators/11836
The PDF file includes 301 documents (over 1,000 pages, over 350,000 characters in total).
Many of these are summaries of examples that logically link higher and lower timeframes using three RCI lines to examine multiple lower-timeframe conditions one by one, ultimately waiting for pullbacks or pullback entries on the lower timeframes (i.e., the mBDSR signals).Also,
there are many that emphasize identifying points where multiple entry rationale coincide..
The explanations usemore than 1,000 charts..

× ![]()


