

[Mass Psychology] A chart shows the moving average line, the double top, and the mBDSR (RCI 2-filter) overbought signal
0
In the recent Investment Navigator+ article,there are many examples that show the high compatibility between various trading methods and mBDSR signalsso you can understand how well they align.
Pound Swiss Franc Weekly
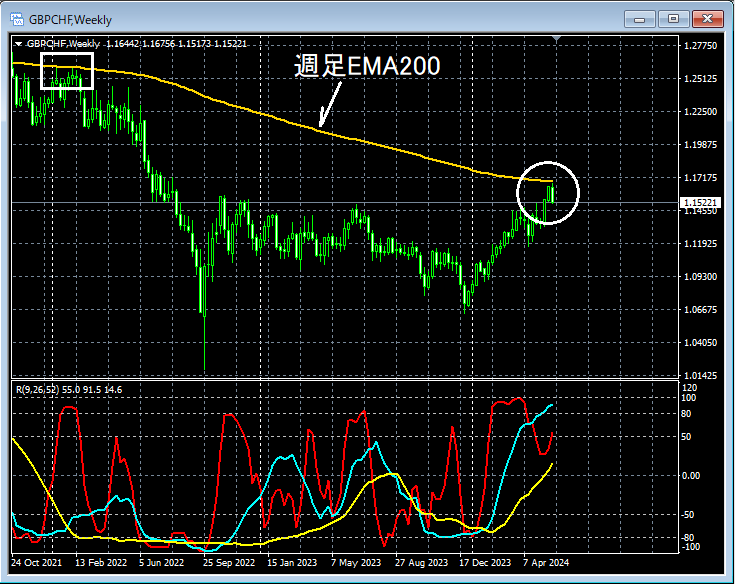
Looking at the area circled in white on the weekly chart above,the moving averagewhich previously acted as resistance has risen toward the vicinity, and thismoving averagearea is perhaps a situation where it would not be surprising to consider a pullback on the lower time frame.
Pound Swiss Franc 30-Minute
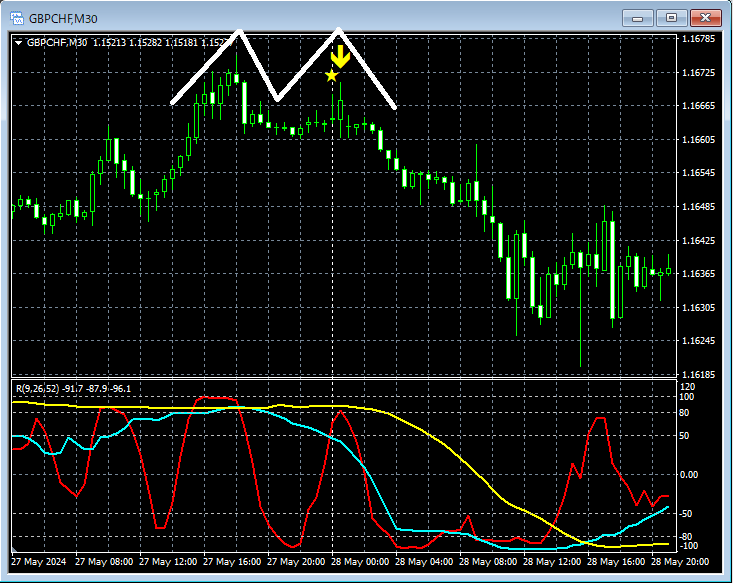
In the 30-minute chart above, the moving average, which has functioned as support in the past, rises towardthe moving averageand thena double topforms and declines. On the right peak of thatdouble top,mBDSR (Filter: RCI26 and RCI52) pullback signallights up.
From this example,a technique that focuses on charted moving averages and double tops (a trading method that emphasizes crowd psychology)andmBDSR signalsshow a high degree of compatibility.
Indicators that shine when combined with RCI: 【BODSOR・mBDSR】
and methodology/case studies (PDF) ★GogoJungle AWARD 2020 winner★
https://www.gogojungle.co.jp/tools/indicators/11836
The PDF file includes 301 documents (over 1,000 pages in total, over 350,000 characters).
Most of them are summaries of examples that logically link higher and lower timeframes using three RCI lines to examine multiple lower-timeframe conditions, ultimately waiting for pullbacks or pullback signals on the lower time frame (i.e., mBDSR signals).
Additionally,many focus on identifying points where multiple entry bases overlap..
In the explanations,over 1,000 chartsare used.

× ![]()


