

[Mass Psychology] Pound/Yen: Return-sell signal at previous high, engulfing candlestick, and mBDSR (RCI two-line filter)
※On May 4, 2024Upgrade of the main indicators of 【mBDSR】was performed.
Not only arrow signals, but alerts are now possible when the star signal lights up for the first time as well.
Also,4K monitor supportallows the arrows and stars to be displayed even larger.
For details, please see the article below on Investment Navigator+.
Version upgrade of the main indicators of mBDSR
https://www.gogojungle.co.jp/finance/navi/articles/69373
In recent Investment Navigator+ articles,there are many examples that show how well different trading methods align with mBDSR signals.
GBP/JPY Daily
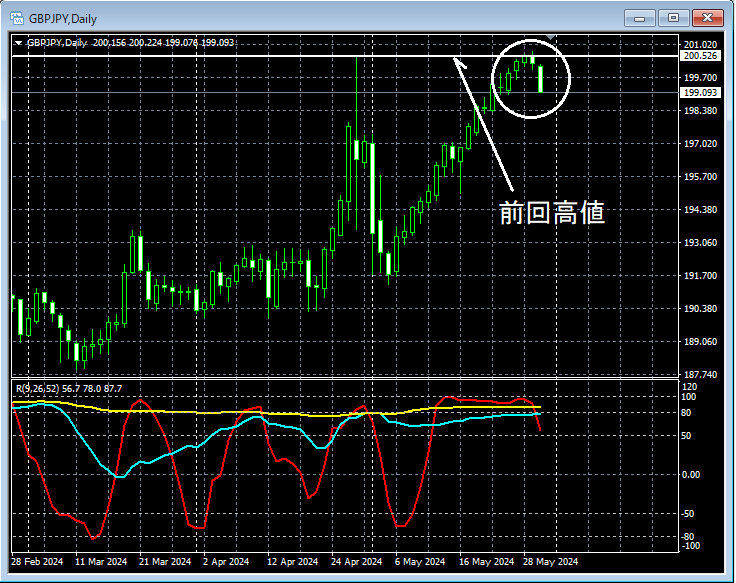
When you look at the area circled in white on the upper daily chart, it seems likely to act as resistance around theprevious highnearby, and it may be a scene where you need to carefully watch whether price breaks through this level and continues rising, or reverses from here.
GBP/JPY 4-hour
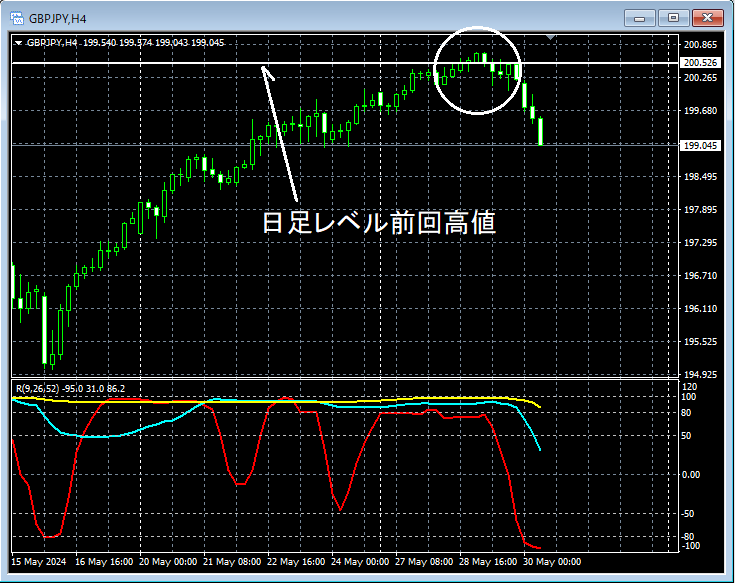
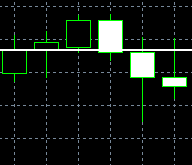
A bullish engulfing pattern in the consolidation zone
in the upper 4-hour chart showsprevious high on the daily levelnearby circled in white, indicating that the price may temporarily break above theprevious high on the daily levelbut then suggest a decline, forming abearish engulfingpattern, which might warrant considering selling on a pullback in lower timeframes.
Note thatengulfingindicates that the selling power of the next candle (bearish) is greater than the buying power of the initial candle (bullish), which may be interpreted as a shift in crowd sentiment to the downside.
GBP/JPY 30-minute
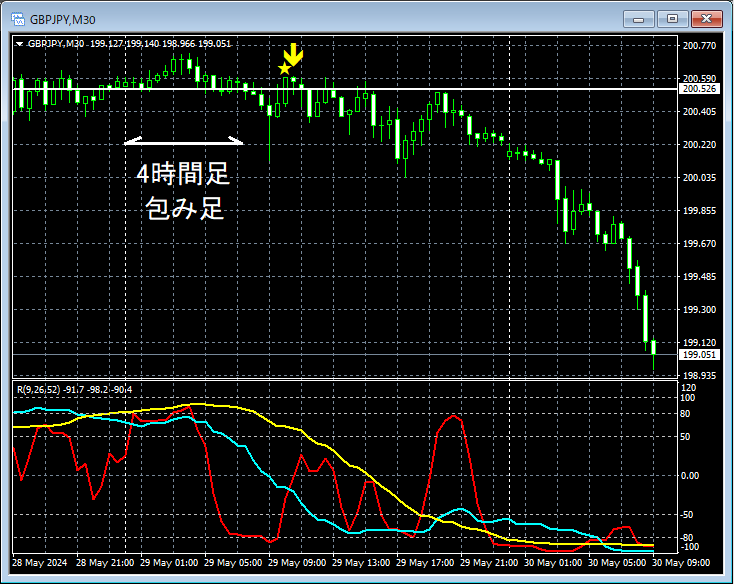
In the upper 30-minute chart, together with the appearance of theengulfingon the 4-hour chart, after a decline, there is a reboundmBDSR (Filter: RCI26 and RCI52) sell-back signal lighting up and the downtrend resumes.
From this example,a trading method focused on the previous high or engulfing patterns recognized as resistance (trading based on crowd psychology)andthe signals of mBDSRshow strong compatibility.
Indicator 【BODSOR・mBDSR】 that shines in combination with RCI
and its method case studies (PDF) ★GogoJungle AWARD 2020 winner★
https://www.gogojungle.co.jp/tools/indicators/11836
The PDF file includes 301 items (over 1,000 pages, over 350,000 characters in total).
Many of theseare examples that logically link higher and lower timeframes using three RCI lines, examine the status of multiple lower timeframes in sequence, and finally wait for a timing to buy on dips or sell on rallies in the lower timeframes (i.e., signals from mBDSR)..
Additionally,there are many that emphasize identifying points where multiple entry reasons overlap..
In the explanations,over 1,000 chart images are used..

Not only arrow signals, but alerts are now possible when the star signal lights up for the first time as well.
Also,4K monitor supportallows the arrows and stars to be displayed even larger.
For details, please see the article below on Investment Navigator+.
Version upgrade of the main indicators of mBDSR
https://www.gogojungle.co.jp/finance/navi/articles/69373
In recent Investment Navigator+ articles,there are many examples that show how well different trading methods align with mBDSR signals.
GBP/JPY Daily
When you look at the area circled in white on the upper daily chart, it seems likely to act as resistance around theprevious highnearby, and it may be a scene where you need to carefully watch whether price breaks through this level and continues rising, or reverses from here.
GBP/JPY 4-hour
A bullish engulfing pattern in the consolidation zone
in the upper 4-hour chart showsprevious high on the daily levelnearby circled in white, indicating that the price may temporarily break above theprevious high on the daily levelbut then suggest a decline, forming abearish engulfingpattern, which might warrant considering selling on a pullback in lower timeframes.
Note thatengulfingindicates that the selling power of the next candle (bearish) is greater than the buying power of the initial candle (bullish), which may be interpreted as a shift in crowd sentiment to the downside.
GBP/JPY 30-minute
In the upper 30-minute chart, together with the appearance of theengulfingon the 4-hour chart, after a decline, there is a reboundmBDSR (Filter: RCI26 and RCI52) sell-back signal lighting up and the downtrend resumes.
From this example,a trading method focused on the previous high or engulfing patterns recognized as resistance (trading based on crowd psychology)andthe signals of mBDSRshow strong compatibility.
Indicator 【BODSOR・mBDSR】 that shines in combination with RCI
and its method case studies (PDF) ★GogoJungle AWARD 2020 winner★
https://www.gogojungle.co.jp/tools/indicators/11836
The PDF file includes 301 items (over 1,000 pages, over 350,000 characters in total).
Many of theseare examples that logically link higher and lower timeframes using three RCI lines, examine the status of multiple lower timeframes in sequence, and finally wait for a timing to buy on dips or sell on rallies in the lower timeframes (i.e., signals from mBDSR)..
Additionally,there are many that emphasize identifying points where multiple entry reasons overlap..
In the explanations,over 1,000 chart images are used..
× ![]()


