

[Mass Psychology] A return-sell signal on the chart for the moving averages in focus, support-resistance turns, and mBDSR (RCI two-filter)
0
In recent articles of Investment Navigator Plus,the high affinity between various trading methods and mBDSR signalsis demonstrated with numerous examples.
EUR/USD 15-minute chart
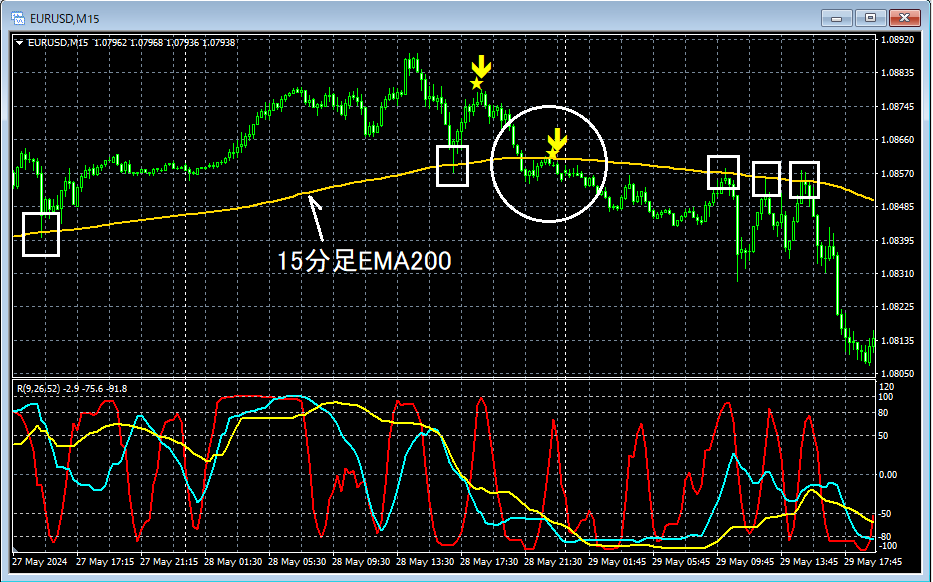
If you look around the area circled in white on the 15-minute chart above, it has functioned as support several times in the pastmoving averagedrawn nearby has clearly been breached,support-resistance flipconcept suggests that thismoving averagemay in the futurefunction as resistanceso it wouldn’t be surprising to consider this a situation where it could act as resistance.
In fact, around the area where thismoving averagehas risen to,mBDSR (Filter: RCI26 and RCI52) pullback-selling signallights up and the price declines.
Conscious of the support-resistance flipandcrowd psychologywhere the moving average has previously functioned as supportmoving averagenearby, it is expected that traders may close long positions or build new short positions.
Also, subsequently, thismoving averagefunctions as resistance and causes a sharp decline.
From this example,a trading method focusing on the support-resistance flip (trading method based on crowd psychology)andmBDSR signalsshow a strong compatibility.
Indicators that excel when combined with RCI【BODSOR・mBDSR】
and method case studies (PDF) ★GogoJungle AWARD 2020 winner★
https://www.gogojungle.co.jp/tools/indicators/11836
The PDF file includes 301 documents (over 1,000 pages in total, over 350,000 characters).
Many of these are compiled as examples that use three-line RCI to logically link higher and lower timeframes, sequentially examine multiple lower-timeframe conditions, and ultimately wait for timing to buy on dips or sell on rallies (i.e., mBDSR signals) on the lower timeframes.Additionally,
many entries focus on identifying points where multiple entry reasons overlap..
Explanation usesover 1,000 charts.

× ![]()


