

[Mass Psychology] AUD/JPY: Return selling signal at the previous high, round number, pin bar, and mBDSR (RCI two-filter)
※On May 4, 2024Upgrade of the main indicators of 【mBDSR】was carried out.
Not only the arrow sign, but also alerts can be triggered when the star sign lights up for the first time.
Also,4K monitor supportallows the arrows and stars to be displayed even larger.
For details, please read the following article on Investment Navigator+.
Upgrade of the main indicators of mBDSR
https://www.gogojungle.co.jp/finance/navi/articles/69373
In recent Investment Navigator+ articles,many examples showing the high compatibility between various trading methods and mBDSR signalsare introduced.
AUDJPY Daily

Looking at the area boxed in white on the daily chart above, it seems to be a resistance levelprevious highthat could become a psychological milestoneround number(105.000) showing twohorizontal linesnearby, and until thesehorizontal linesare clearly broken to the upside, it might not be unusual to look for sell-offs on lower timeframes.
AUDJPY 15-minute chart
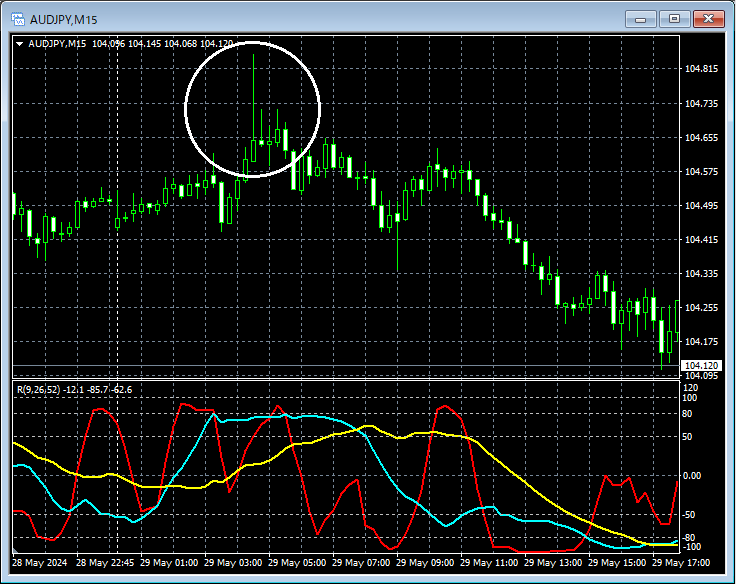
On the upper 15-minute chartDaily-level previous highnear the boxed white area, a candlestick with a long lower shadowpin barhas appeared, suggesting a continuation to the downside on lower timeframes.
Also,Pin Baris a pattern where a trader who jumped into a strong rally may get trapped. Public sentiment is interpreted as turning bearish.
AUDJPY 1-minute chart
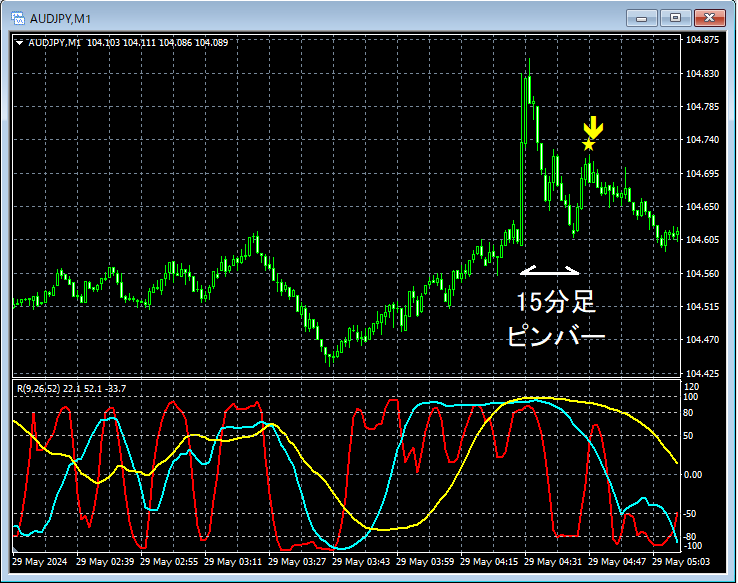
On the 1-minute chart above, together with the appearance of apin baron the 15-minute chart, the subsequent rise after the dipmBDSR re-entry/sell signallights up and the decline resumes.
From this example,a trading method focusing on interactions with resistance/previous highs, psychological milestones such as round numbers and pin bars (signs of crowd psychology)andthe signals of mBDSRshow high compatibility.
Indicator that delivers power in combination with RCI【BODSOR・mBDSR】
and techniques/case studies (PDF) ★GogoJungle AWARD 2020 winner★
https://www.gogojungle.co.jp/tools/indicators/11836
The PDF file includes 301 items (over 1,000 pages in total, over 350,000 characters).
Most of them are compiled as examples that use three RCI lines to logically link higher and lower timeframes, sequentially examining multiple subordinate timeframe conditions, and ultimately waiting for a buying opportunity on the lower timeframe or a pullback sell timing (i.e., mBDSR signals).
Also,many of them emphasize capturing points where multiple entry reasons overlap..
The explanation usesmore than 1,000 charts.

Not only the arrow sign, but also alerts can be triggered when the star sign lights up for the first time.
Also,4K monitor supportallows the arrows and stars to be displayed even larger.
For details, please read the following article on Investment Navigator+.
Upgrade of the main indicators of mBDSR
https://www.gogojungle.co.jp/finance/navi/articles/69373
In recent Investment Navigator+ articles,many examples showing the high compatibility between various trading methods and mBDSR signalsare introduced.
AUDJPY Daily
Looking at the area boxed in white on the daily chart above, it seems to be a resistance levelprevious highthat could become a psychological milestoneround number(105.000) showing twohorizontal linesnearby, and until thesehorizontal linesare clearly broken to the upside, it might not be unusual to look for sell-offs on lower timeframes.
AUDJPY 15-minute chart
On the upper 15-minute chartDaily-level previous highnear the boxed white area, a candlestick with a long lower shadowpin barhas appeared, suggesting a continuation to the downside on lower timeframes.
Also,Pin Baris a pattern where a trader who jumped into a strong rally may get trapped. Public sentiment is interpreted as turning bearish.
AUDJPY 1-minute chart
On the 1-minute chart above, together with the appearance of apin baron the 15-minute chart, the subsequent rise after the dipmBDSR re-entry/sell signallights up and the decline resumes.
From this example,a trading method focusing on interactions with resistance/previous highs, psychological milestones such as round numbers and pin bars (signs of crowd psychology)andthe signals of mBDSRshow high compatibility.
Indicator that delivers power in combination with RCI【BODSOR・mBDSR】
and techniques/case studies (PDF) ★GogoJungle AWARD 2020 winner★
https://www.gogojungle.co.jp/tools/indicators/11836
The PDF file includes 301 items (over 1,000 pages in total, over 350,000 characters).
Most of them are compiled as examples that use three RCI lines to logically link higher and lower timeframes, sequentially examining multiple subordinate timeframe conditions, and ultimately waiting for a buying opportunity on the lower timeframe or a pullback sell timing (i.e., mBDSR signals).
Also,many of them emphasize capturing points where multiple entry reasons overlap..
The explanation usesmore than 1,000 charts.
× ![]()


