

[Mass Psychology] Chart shows the levels of conscious horizontal line, a double top, and the mbDSR (RCI two-filter) pullback selling signal
0
In recent Investment Navi+ articles,there are many examples showing the high affinity between various trading methods and mBDSR signalsthat can be understood.
EUR/USD 1-hour chart
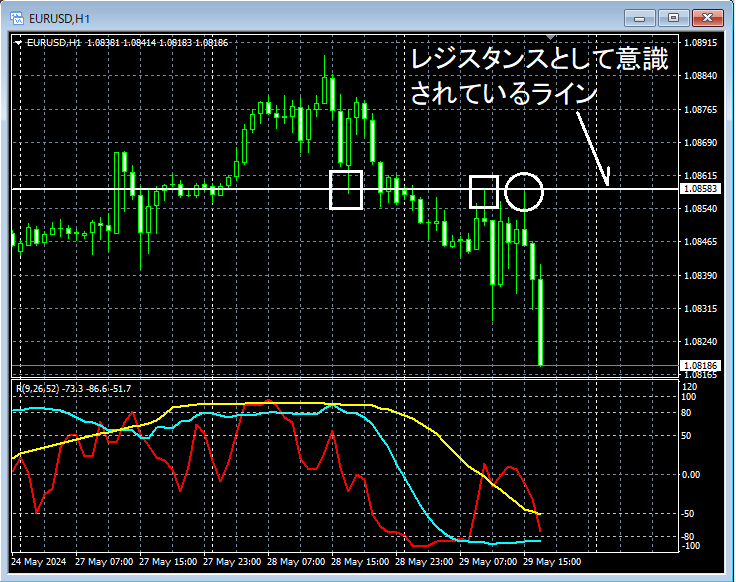
From the area circled in white on the 1-hour chart above, it has previously functioned as support and resistancehorizontal linesapproaching and rising toward this region, andhorizontal lineuntil it clearly breaks above this level, it may be reasonable to consider selling on retracements on lower timeframes.
EUR/USD 1-minute chart
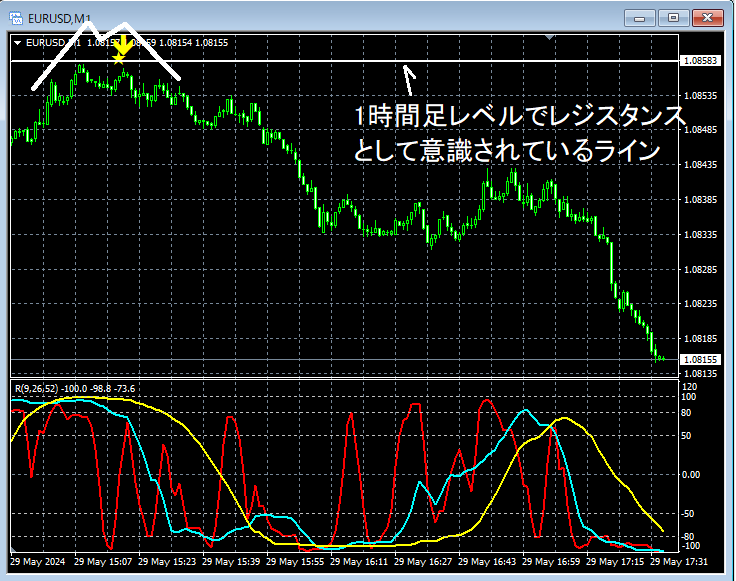
On the 1-minute chart above, near the area that has historically acted as support or resistancehorizontal linethedouble topformed and then fell back. As a result, at the right peak of thatdouble top,mBDSR (Filter: RCI26 and RCI52) sell signallights up as it moves lower.
From this example,a trading method that focuses on resistance-identified horizontal lines and double tops (a method paying attention to crowd psychology)andthe mBDSR signalsshow a strong affinity.
Indicators that excel in combination with RCI [BODSOR・mBDSR]
and method/case studies (PDF) ★GogoJungle AWARD 2020 winner★
https://www.gogojungle.co.jp/tools/indicators/11836
The PDF file includes 301 items (over 1,000 pages, over 350,000 characters in total).
Many of them areexamples that link the higher-timeframe and lower-timeframe logically using three RCI lines, sequentially examining multiple lower-timeframe conditions, and ultimately explaining the moment to buy on dips or sell on retracements on the lower timeframes (i.e., waiting for mBDSR signals)..
Also,many emphasize identifying points where multiple entry reasons coincide..
The explanations usemore than a thousand charts.

× ![]()


