

[Mass Psychology] A chart showing the conscious horizontal line, pin bar, and mBDSR (RCI two-filter) selling signals on pullbacks
0
※On May 4, 2024Upgrade of major indicators for 【mBDSR】has been carried out.
Not only the arrow signs, but also alerts can be generated when the star sign lights up for the first time.
Also,4K monitor supportallows the arrows and stars to be displayed even larger.
For details, please see the article below on Investment Navi+.
About the version upgrade of major indicators for 【mBDSR】
https://www.gogojungle.co.jp/finance/navi/articles/69373
In recent Investment Navi+ articles,there are many examples that show the high compatibility between various trading methods and mBDSR signalsso you can understand.
EUR/USD Daily
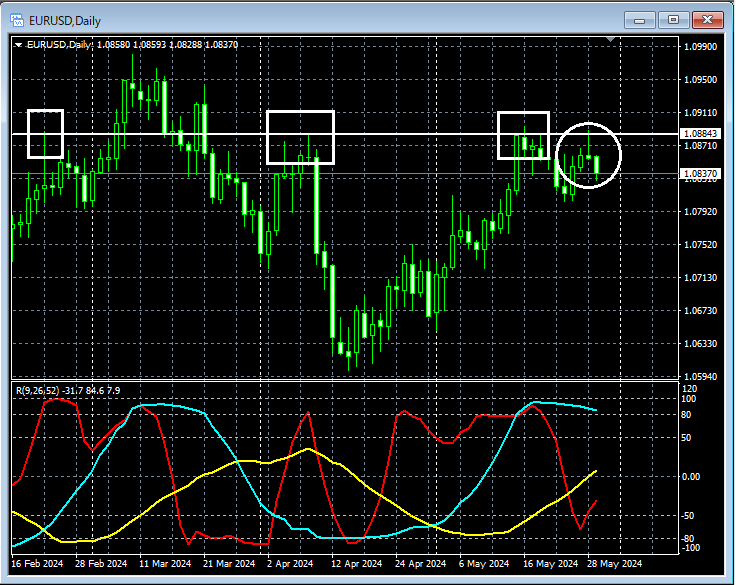
If you look around the area circled in white on the above 1-hour charta horizontal line that is regarded as a resistance level on the chartis nearing, suggesting a potential declinePin Barhorizontal lineon the lower timeframe, it may be reasonable to consider selling on rallies.Pin Baris a pattern where traders who jumped in during strong rises (or falls) end up caught.
EUR/USD 1-hour
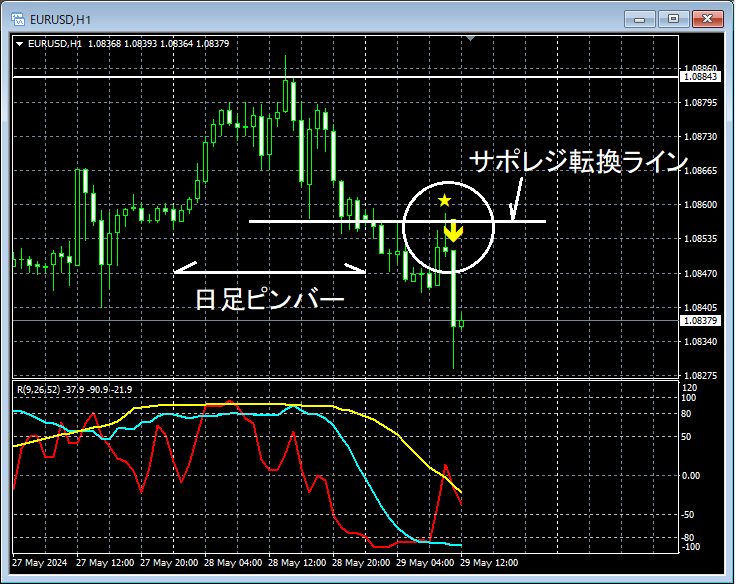
In the above 1-hour chart, together with the appearance of the daily Pin Bar, it declined and then roseSupport/Resistance turning linecould not be surpassedPin Barappears. Immediately afterward,mBDSR (filter: RCI26 and RCI52) bullish reversal signallights up and it continues to fall.
From this example,a trading method focused on pin bars and chart-known horizontal lines (a crowd psychology-based trading method)andmBDSR signalsshow a strong synergy.
Indicators that excel in combination with RCI: 【BODSOR・mBDSR】
and method-case studies (PDF) ★GogoJungle AWARD 2020 winner★
https://www.gogojungle.co.jp/tools/indicators/11836
The PDF file consists of 301 items (over 1,000 pages, over 350,000 characters in total).
Most of them are compiled as examples that link multiple lower timeframes logically with the higher timeframe by using three RCI lines, ultimately waiting for a timing to buy on dips or to sell on rallies in the lower timeframes (i.e., mBDSR signals).
Also,many of them focus on capturing points where multiple entry reasons overlap..
In the explanations,more than 1,000 chartsare used.

Not only the arrow signs, but also alerts can be generated when the star sign lights up for the first time.
Also,4K monitor supportallows the arrows and stars to be displayed even larger.
For details, please see the article below on Investment Navi+.
About the version upgrade of major indicators for 【mBDSR】
https://www.gogojungle.co.jp/finance/navi/articles/69373
In recent Investment Navi+ articles,there are many examples that show the high compatibility between various trading methods and mBDSR signalsso you can understand.
EUR/USD Daily
If you look around the area circled in white on the above 1-hour charta horizontal line that is regarded as a resistance level on the chartis nearing, suggesting a potential declinePin Barhorizontal lineon the lower timeframe, it may be reasonable to consider selling on rallies.Pin Baris a pattern where traders who jumped in during strong rises (or falls) end up caught.
EUR/USD 1-hour
In the above 1-hour chart, together with the appearance of the daily Pin Bar, it declined and then roseSupport/Resistance turning linecould not be surpassedPin Barappears. Immediately afterward,mBDSR (filter: RCI26 and RCI52) bullish reversal signallights up and it continues to fall.
From this example,a trading method focused on pin bars and chart-known horizontal lines (a crowd psychology-based trading method)andmBDSR signalsshow a strong synergy.
Indicators that excel in combination with RCI: 【BODSOR・mBDSR】
and method-case studies (PDF) ★GogoJungle AWARD 2020 winner★
https://www.gogojungle.co.jp/tools/indicators/11836
The PDF file consists of 301 items (over 1,000 pages, over 350,000 characters in total).
Most of them are compiled as examples that link multiple lower timeframes logically with the higher timeframe by using three RCI lines, ultimately waiting for a timing to buy on dips or to sell on rallies in the lower timeframes (i.e., mBDSR signals).
Also,many of them focus on capturing points where multiple entry reasons overlap..
In the explanations,more than 1,000 chartsare used.
× ![]()


