

[Mass Psychology] Two-bar reversal, double top, and mbDSR (RCI 2-band filter) short signal reversal
※On May 4, 2024Major indicators of 【mBDSR】 have been upgraded.
Not only the arrow signs, but also alerting when the star signs light up for the first time has been added.
Also,4K monitor supportallows the arrows and stars to be displayed even larger.
For details, please see the article below in Investment Navigator Plus.
About the version upgrade of the major indicators of 【mBDSR】
https://www.gogojungle.co.jp/finance/navi/articles/69373
In recent Investment Navigator Plus articles,many examples illustrate the strong compatibility between various trading methods and mBDSR signals.
USD/JPY, 1-hour chart
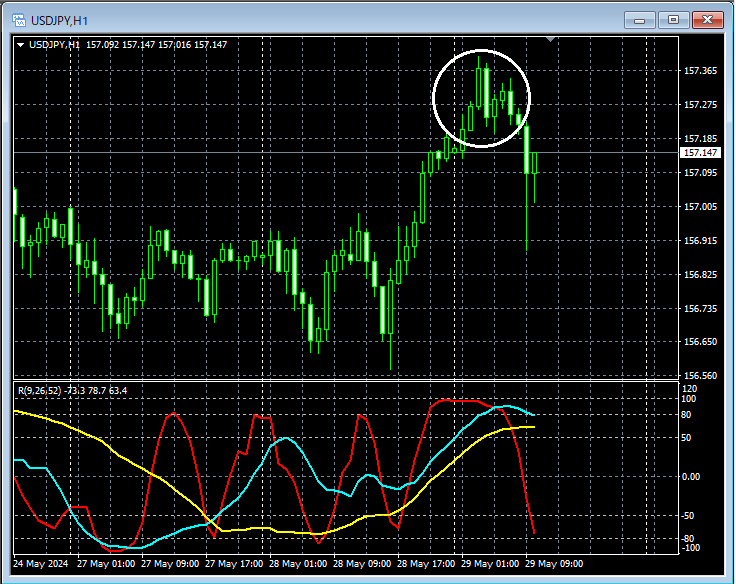
Looking at the area circled in white on the above 1-hour chart suggests a decline when a high is reached, showing aTwo-Barrier Reversalappears, and until this high is clearly broken to the upside, it may be reasonable to consider selling rallies on lower timeframes.Two-Barrier Reversalis a pattern where traders who jump in during a strong rise (or fall) get caught.
USD/JPY, 15-minute chart
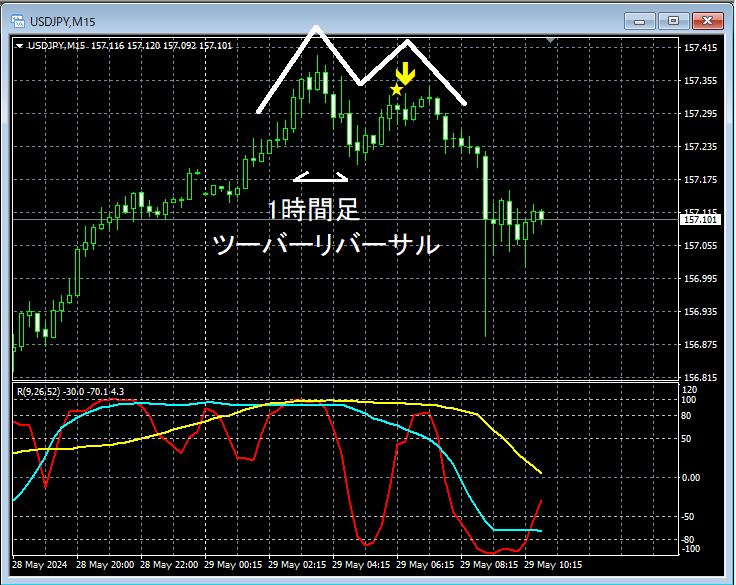
On the 15-minute chart above, with the appearance ofTwo-Barrier Reversalon the 1-hour chart, after a decline followed by a risemBDSR (filter: RCI26 and RCI52) sell-on-rally signallights up and the price falls furtherDouble Topis formed.
From this example,a trading method focusing on Two-Barrier Reversal and Double Top (trading method focused on crowd psychology)andthe signals of mBDSRshow high compatibility.
Indicators that shine when combined with RCI: 【BODSOR・mBDSR】
and techniques/case studies (PDF) ★GogoJungle AWARD 2020 winner★
https://www.gogojungle.co.jp/tools/indicators/11836
The PDF files amount to 301 items (over 1,000 pages, over 350,000 characters in total).
Many of them describe using three RCI lines to logically link higher and lower timeframes, examining multiple lower-timeframe conditions sequentially, and ultimately waiting for the timing to buy on dips or sell on rallies on the lower timeframes (i.e., signals of mBDSR).
Additionally,many focus on identifying points where multiple entry reasons align..
In the explanations,over 1,000 chartsare used.

Not only the arrow signs, but also alerting when the star signs light up for the first time has been added.
Also,4K monitor supportallows the arrows and stars to be displayed even larger.
For details, please see the article below in Investment Navigator Plus.
About the version upgrade of the major indicators of 【mBDSR】
https://www.gogojungle.co.jp/finance/navi/articles/69373
In recent Investment Navigator Plus articles,many examples illustrate the strong compatibility between various trading methods and mBDSR signals.
USD/JPY, 1-hour chart
Looking at the area circled in white on the above 1-hour chart suggests a decline when a high is reached, showing aTwo-Barrier Reversalappears, and until this high is clearly broken to the upside, it may be reasonable to consider selling rallies on lower timeframes.Two-Barrier Reversalis a pattern where traders who jump in during a strong rise (or fall) get caught.
USD/JPY, 15-minute chart
On the 15-minute chart above, with the appearance ofTwo-Barrier Reversalon the 1-hour chart, after a decline followed by a risemBDSR (filter: RCI26 and RCI52) sell-on-rally signallights up and the price falls furtherDouble Topis formed.
From this example,a trading method focusing on Two-Barrier Reversal and Double Top (trading method focused on crowd psychology)andthe signals of mBDSRshow high compatibility.
Indicators that shine when combined with RCI: 【BODSOR・mBDSR】
and techniques/case studies (PDF) ★GogoJungle AWARD 2020 winner★
https://www.gogojungle.co.jp/tools/indicators/11836
The PDF files amount to 301 items (over 1,000 pages, over 350,000 characters in total).
Many of them describe using three RCI lines to logically link higher and lower timeframes, examining multiple lower-timeframe conditions sequentially, and ultimately waiting for the timing to buy on dips or sell on rallies on the lower timeframes (i.e., signals of mBDSR).
Additionally,many focus on identifying points where multiple entry reasons align..
In the explanations,over 1,000 chartsare used.
× ![]()


