

[Mass Psychology] Pinbar, Two-Bar Reversal, and Double Top with mbDSR (RCI2-band filter) Sell Signals
※On May 4, 2024An upgrade of the main indicators of 【mBDSR】was implemented.
Not only the arrow signs, but also the star signs light up for the first time triggering alerts.
Additionally,4K monitor compatibilityallows the arrows and stars to be displayed even larger.
For details, please see the article below on Investment Navi+.
Upgrade of the main indicators of 【mBDSR】
https://www.gogojungle.co.jp/finance/navi/articles/69373
In recent Investment Navi+ articles,numerous examples show the high compatibility between various trading methods and mBDSR signalsso you can see how they align.
EUR/JPY 1-hour chart
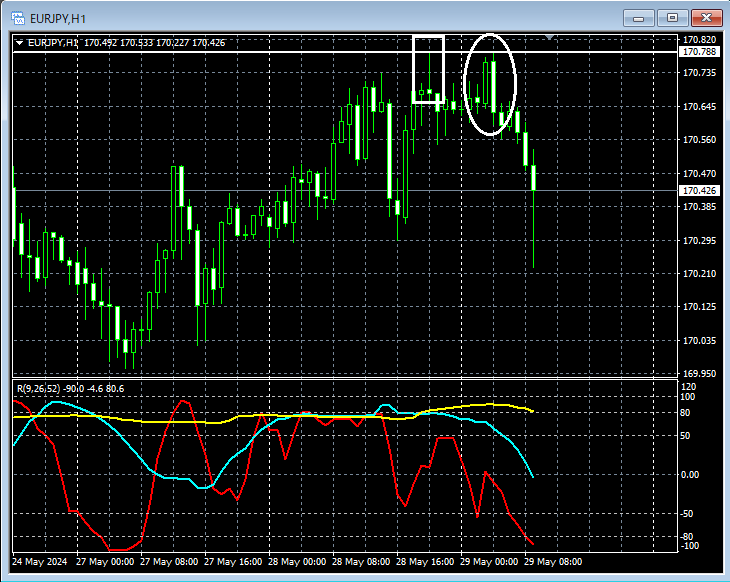
Looking at the area surrounded by a white box on the 1-hour chart above, a decline is suggested when a high is reachedPin Bar(long upper shadow candlestick) appears and this high is breachedHorizontal linemay be perceived as resistance. When the price rises again, looking at the area circled in white suggests a further declineTwo-Top Reversalappears. Thishorizontal line
EUR/JPY 15-minute chart
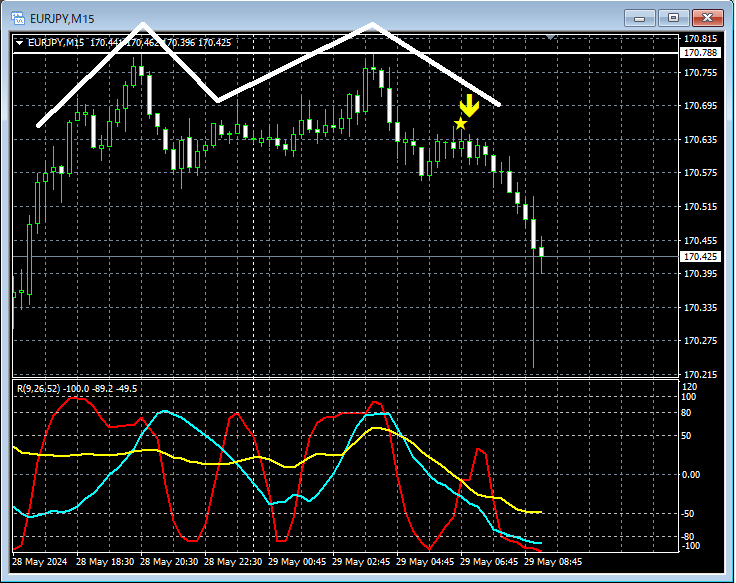
On the 15-minute chart above, with the appearance of theTwo-Top Reversalon the 1-hour chart, during the subsequent rise after the declinemBDSR (Filter: RCI26 and RCI52) sell signallights up and then declines furtherDouble Topis formed.
From this example,a trading method focusing on pin bars, two-top reversals, and resistance horizontal lines (a crowd-psychology-based trading method)andmBDSR signalsshow a high degree of harmony.
Indicators that work powerfully in combination with RCI: 【BODSOR・mBDSR】
and method/case studies (PDF) ★GogoJungle AWARD 2020 winner★
https://www.gogojungle.co.jp/tools/indicators/11836
The PDF file includes 301 documents (over 1,000 pages, over 350,000 characters in total).
Most of these are compiled into examples that consider the multiple-timeframe status by logically linking the upper and lower timeframes using three RCI lines, ultimately waiting for timing to buy on dips or sell on rallies on the lower timeframes (i.e., the mBDSR signals).
Additionally,many of them focus on identifying points where multiple entry reasons overlap.There are many such cases.
Explanation includesover 1,000 chartsused.

Not only the arrow signs, but also the star signs light up for the first time triggering alerts.
Additionally,4K monitor compatibilityallows the arrows and stars to be displayed even larger.
For details, please see the article below on Investment Navi+.
Upgrade of the main indicators of 【mBDSR】
https://www.gogojungle.co.jp/finance/navi/articles/69373
In recent Investment Navi+ articles,numerous examples show the high compatibility between various trading methods and mBDSR signalsso you can see how they align.
EUR/JPY 1-hour chart
Looking at the area surrounded by a white box on the 1-hour chart above, a decline is suggested when a high is reachedPin Bar(long upper shadow candlestick) appears and this high is breachedHorizontal linemay be perceived as resistance. When the price rises again, looking at the area circled in white suggests a further declineTwo-Top Reversalappears. Thishorizontal line
EUR/JPY 15-minute chart
On the 15-minute chart above, with the appearance of theTwo-Top Reversalon the 1-hour chart, during the subsequent rise after the declinemBDSR (Filter: RCI26 and RCI52) sell signallights up and then declines furtherDouble Topis formed.
From this example,a trading method focusing on pin bars, two-top reversals, and resistance horizontal lines (a crowd-psychology-based trading method)andmBDSR signalsshow a high degree of harmony.
Indicators that work powerfully in combination with RCI: 【BODSOR・mBDSR】
and method/case studies (PDF) ★GogoJungle AWARD 2020 winner★
https://www.gogojungle.co.jp/tools/indicators/11836
The PDF file includes 301 documents (over 1,000 pages, over 350,000 characters in total).
Most of these are compiled into examples that consider the multiple-timeframe status by logically linking the upper and lower timeframes using three RCI lines, ultimately waiting for timing to buy on dips or sell on rallies on the lower timeframes (i.e., the mBDSR signals).
Additionally,many of them focus on identifying points where multiple entry reasons overlap.There are many such cases.
Explanation includesover 1,000 chartsused.
× ![]()


