

[Mass Psychology] The chart’s horizontal line that is being watched and the re-sell signal from the mBDSR (RCI2-band filter)
※May 4, 2024Upgrading the main indicators of 【mBDSR】 has been carried out.
Not only the arrow signs, but also at the first lighting of the star sign an alert can now be generated.
Also,4K monitor support makes it possible to display the arrow and star signs even larger.
For details, please read the article below from Investment Navi+.
About the version upgrade of the main indicators of 【mBDSR】
https://www.gogojungle.co.jp/finance/navi/articles/69373
In recent Investment Navi+ articles, there are many examples showing the high compatibility between various trading methods and mBDSR signals.
GBP/USD Daily
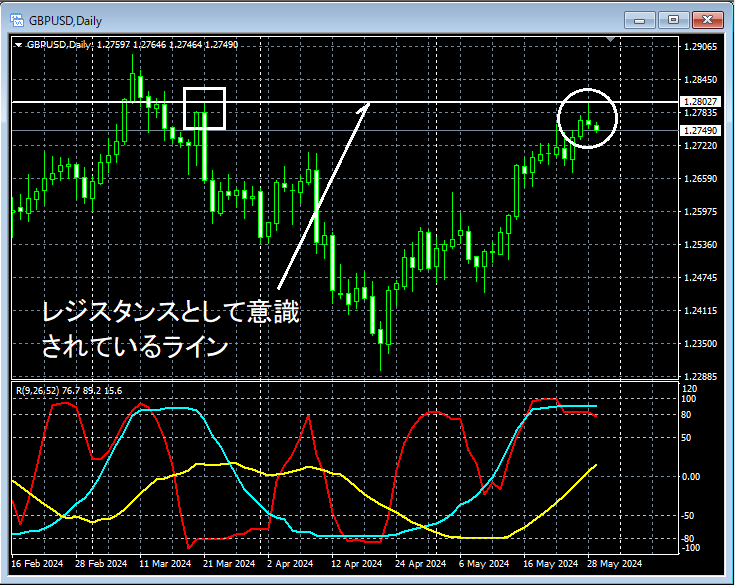
Looking at the area circled in white on the upper daily chart, it has functioned as resistance several times in the pasthorizontal linehas risen near this area, and untilhorizontal lineis clearly broken upward, it may not be strange to consider a retracement selling on lower timeframes.
GBP/USD 5-minute
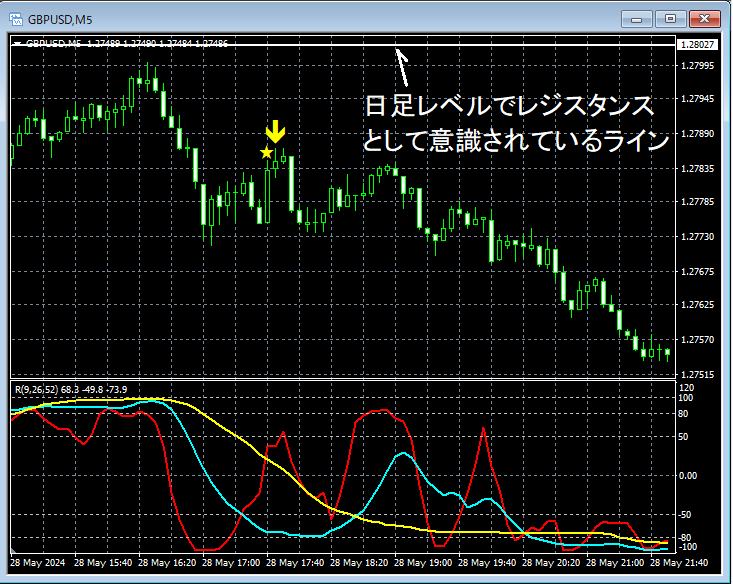
In the upper 5-minute chart, it has previously acted as resistance several timeshorizontal linenearby shows signs of turning down. In the subsequent risemBDSR (Filter: RCI26 and RCI52) retracement sell signal lights up and the price declines.
From this example,a trading method focused on the horizontal line acting as resistance (a trading method focused on crowd psychology) andmBDSR signals show a strong harmony.
An indicator that shines in combination with RCI: 【BODSOR・mBDSR】
and the method/case study (PDF) ★GogoJungle AWARD 2020 winner★
https://www.gogojungle.co.jp/tools/indicators/11836
The PDF file includes 301 files (over 1,000 pages, over 350,000 characters in total).
Many of them are designed as examples that tie together multiple lower-timeframe conditions by logically linking higher and lower timeframes using three RCI lines, ultimately waiting for timing to buy on dips or sell on rallies on the lower timeframes (i.e., mBDSR signals).
Also,many of them focus on capturing points where multiple entry bases overlap..
In the explanations,more than 1,000 charts are used.

Not only the arrow signs, but also at the first lighting of the star sign an alert can now be generated.
Also,4K monitor support makes it possible to display the arrow and star signs even larger.
For details, please read the article below from Investment Navi+.
About the version upgrade of the main indicators of 【mBDSR】
https://www.gogojungle.co.jp/finance/navi/articles/69373
In recent Investment Navi+ articles, there are many examples showing the high compatibility between various trading methods and mBDSR signals.
GBP/USD Daily
Looking at the area circled in white on the upper daily chart, it has functioned as resistance several times in the pasthorizontal linehas risen near this area, and untilhorizontal lineis clearly broken upward, it may not be strange to consider a retracement selling on lower timeframes.
GBP/USD 5-minute
In the upper 5-minute chart, it has previously acted as resistance several timeshorizontal linenearby shows signs of turning down. In the subsequent risemBDSR (Filter: RCI26 and RCI52) retracement sell signal lights up and the price declines.
From this example,a trading method focused on the horizontal line acting as resistance (a trading method focused on crowd psychology) andmBDSR signals show a strong harmony.
An indicator that shines in combination with RCI: 【BODSOR・mBDSR】
and the method/case study (PDF) ★GogoJungle AWARD 2020 winner★
https://www.gogojungle.co.jp/tools/indicators/11836
The PDF file includes 301 files (over 1,000 pages, over 350,000 characters in total).
Many of them are designed as examples that tie together multiple lower-timeframe conditions by logically linking higher and lower timeframes using three RCI lines, ultimately waiting for timing to buy on dips or sell on rallies on the lower timeframes (i.e., mBDSR signals).
Also,many of them focus on capturing points where multiple entry bases overlap..
In the explanations,more than 1,000 charts are used.
× ![]()


