

[Mass Psychology] Signals of the consciously identified horizontal line, breaking of support, and mBDSR (RCI2 two-filter) in the chart
※May 4, 2024Upgrade of the main indicators of【mBDSR】has been carried out.
Not only the arrow signs, but also an alert can be issued when the star sign lights up for the first time.
Also,4K monitor supportallows the arrow and star signs to be displayed even larger.
For details, please read the article below on Investment Navi+.
About the version upgrade of the main indicators of【mBDSR】
https://www.gogojungle.co.jp/finance/navi/articles/69373
In recent Investment Navi+ articles,there are many examples showing the high compatibility between various trading methods and signals from mBDSRso you can see.
EURUSD Daily
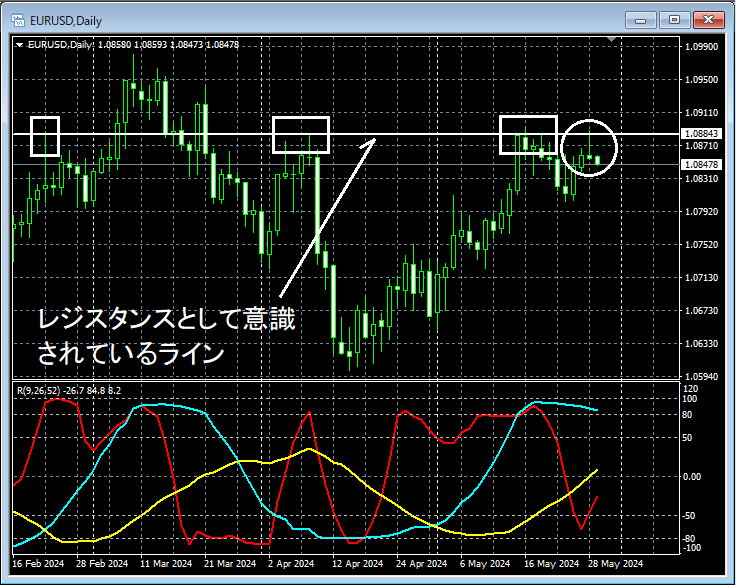
Looking at the area circled in white on the upper daily chart, it has functioned as resistance several times in the pasthorizontal linenearby, and until thishorizontal lineis clearly broken upward, it may not be strange to consider selling on lower timeframes on pullbacks.
EURUSD 15-minute
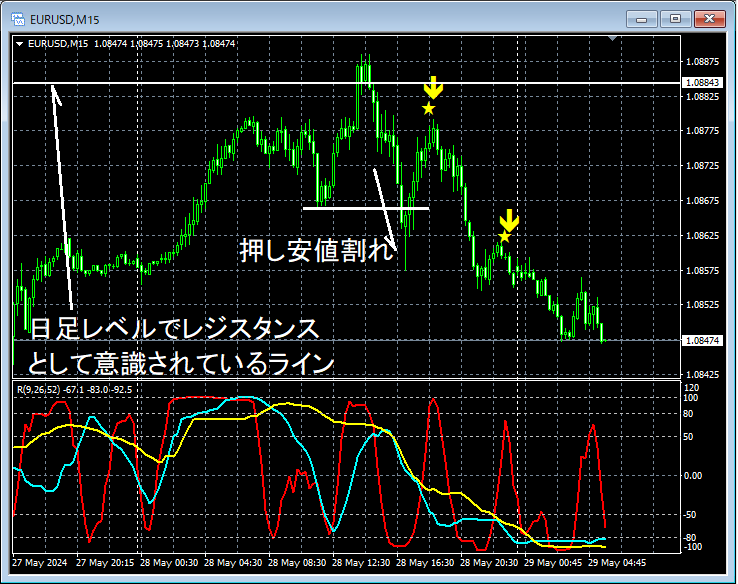
On the upper 15-minute chart, the area has acted as resistance several timeshorizontal lineand reversed near it-support lowerand after breaking above, with a risemBDSR (Filter: RCI26 and RCI52) pullback selling signallighting up and the price descending.
From this example,a trading method focused on resistance horizontal lines and Dow TheoryandmBDSR signalsshow a high degree of harmony.
An indicator that shows power when combined with RCI,【BODSOR・mBDSR】
and case studies (PDF) ★GogoJungle AWARD2020 winner★
https://www.gogojungle.co.jp/tools/indicators/11836
The PDF file includes 301 documents (over 1,000 pages, over 350,000 characters).
Most of them aresummaries of how to logically link the higher and lower timeframes using three RCI lines to analyze multiple lower timeframes sequentially, and finally wait for the timing to buy on dips or sell on rallies on the lower timeframe (i.e., signals from mBDSR)..
Also,many of them focus on identifying points where multiple entry signals coincide..
The explanations useover 1,000 charts.

Not only the arrow signs, but also an alert can be issued when the star sign lights up for the first time.
Also,4K monitor supportallows the arrow and star signs to be displayed even larger.
For details, please read the article below on Investment Navi+.
About the version upgrade of the main indicators of【mBDSR】
https://www.gogojungle.co.jp/finance/navi/articles/69373
In recent Investment Navi+ articles,there are many examples showing the high compatibility between various trading methods and signals from mBDSRso you can see.
EURUSD Daily
Looking at the area circled in white on the upper daily chart, it has functioned as resistance several times in the pasthorizontal linenearby, and until thishorizontal lineis clearly broken upward, it may not be strange to consider selling on lower timeframes on pullbacks.
EURUSD 15-minute
On the upper 15-minute chart, the area has acted as resistance several timeshorizontal lineand reversed near it-support lowerand after breaking above, with a risemBDSR (Filter: RCI26 and RCI52) pullback selling signallighting up and the price descending.
From this example,a trading method focused on resistance horizontal lines and Dow TheoryandmBDSR signalsshow a high degree of harmony.
An indicator that shows power when combined with RCI,【BODSOR・mBDSR】
and case studies (PDF) ★GogoJungle AWARD2020 winner★
https://www.gogojungle.co.jp/tools/indicators/11836
The PDF file includes 301 documents (over 1,000 pages, over 350,000 characters).
Most of them aresummaries of how to logically link the higher and lower timeframes using three RCI lines to analyze multiple lower timeframes sequentially, and finally wait for the timing to buy on dips or sell on rallies on the lower timeframe (i.e., signals from mBDSR)..
Also,many of them focus on identifying points where multiple entry signals coincide..
The explanations useover 1,000 charts.
× ![]()


