

[Mass Psychology] Buy signal on pullbacks indicated by the moving average line, counter-trend line, and mBDSR (RCI two-filter) in the chart
※ On May 4, 2024, Upgrades to the main indicators of 【mBDSR】 were carried out.
Not only the arrow signs, but also the star signs can now trigger alerts when they first light up.
Also,4K monitor support makes it possible to display arrows and stars even larger.
For details, please see the article below on Investment Navigator+.
About the version upgrade of the main indicators of mBDSR
https://www.gogojungle.co.jp/finance/navi/articles/69373
In recent Investment Navigator+ articles,there are many examples showing the high compatibility between various trading methods and mBDSR signalsso you can see how well they work together.
EUR/JPY 1-hour chart
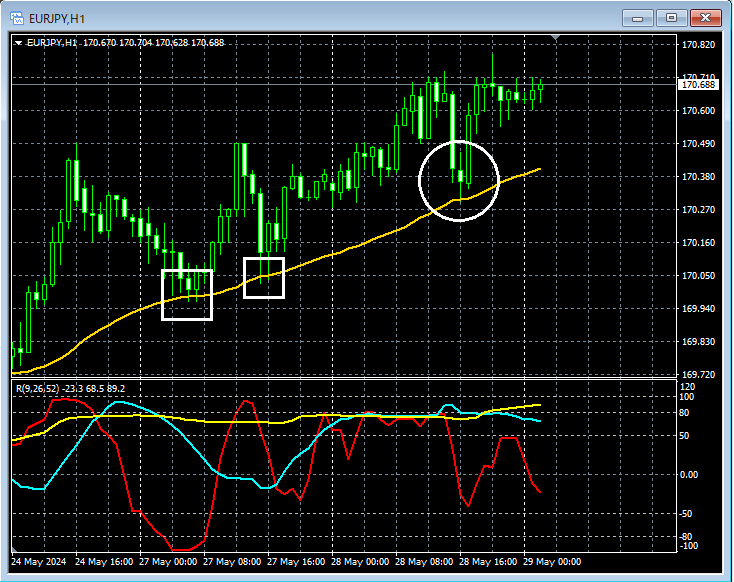
If you look at the area circled in white on the 1-hour chart above, it has historically functioned as support several times near themoving averagearea, and until thismoving averageis clearly broken to the downside, it might not be strange to consider buying on lower timeframes.
EUR/JPY 1-minute chart
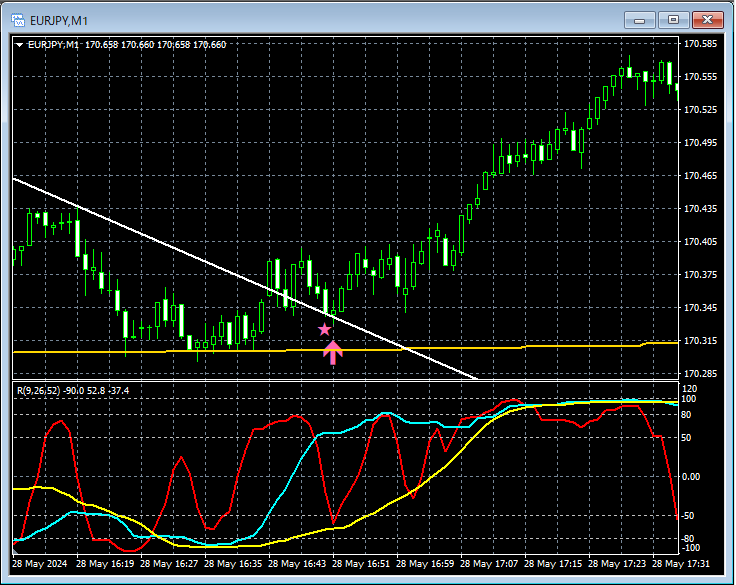
On the above 1-minute chart, near themoving averagewhich has acted as support several times before, it reboundedcounter-trend lineand after breaking above, on the subsequent declinemBDSR (Filter: RCI26 and RCI52) pullback buy signallights up and rises.
From this example,the trading method focused on moving averages and counter-trend linesandthe mBDSR signalsshow a strong compatibility.
Indicators that excel when combined with RCI: 【BODSOR・mBDSR】
and the method & case studies (PDF) ★GogoJungle AWARD 2020 winner★
https://www.gogojungle.co.jp/tools/indicators/11836
The PDF file includes 301 items (totaling over 1,000 pages and over 350,000 characters).
Many of them are summaries of examples where, by using three RCI lines to logically link higher and lower timeframes, multiple lower-timeframe conditions are examined sequentially, ultimately waiting for the timing to buy on dips or sell on rallies on the lower timeframe (the mBDSR signal).
Also,many are focused on capturing points where multiple entry reasons coincide..
For explanations,over 1,000 chartsare used.

Not only the arrow signs, but also the star signs can now trigger alerts when they first light up.
Also,4K monitor support makes it possible to display arrows and stars even larger.
For details, please see the article below on Investment Navigator+.
About the version upgrade of the main indicators of mBDSR
https://www.gogojungle.co.jp/finance/navi/articles/69373
In recent Investment Navigator+ articles,there are many examples showing the high compatibility between various trading methods and mBDSR signalsso you can see how well they work together.
EUR/JPY 1-hour chart
If you look at the area circled in white on the 1-hour chart above, it has historically functioned as support several times near themoving averagearea, and until thismoving averageis clearly broken to the downside, it might not be strange to consider buying on lower timeframes.
EUR/JPY 1-minute chart
On the above 1-minute chart, near themoving averagewhich has acted as support several times before, it reboundedcounter-trend lineand after breaking above, on the subsequent declinemBDSR (Filter: RCI26 and RCI52) pullback buy signallights up and rises.
From this example,the trading method focused on moving averages and counter-trend linesandthe mBDSR signalsshow a strong compatibility.
Indicators that excel when combined with RCI: 【BODSOR・mBDSR】
and the method & case studies (PDF) ★GogoJungle AWARD 2020 winner★
https://www.gogojungle.co.jp/tools/indicators/11836
The PDF file includes 301 items (totaling over 1,000 pages and over 350,000 characters).
Many of them are summaries of examples where, by using three RCI lines to logically link higher and lower timeframes, multiple lower-timeframe conditions are examined sequentially, ultimately waiting for the timing to buy on dips or sell on rallies on the lower timeframe (the mBDSR signal).
Also,many are focused on capturing points where multiple entry reasons coincide..
For explanations,over 1,000 chartsare used.
× ![]()


