

Buyback price (Dow Theory) and mBDSR (RCI 2-band filter) selling signal
※May 4, 2024Upgrade of major indicators for 【mBDSR】 has been implemented.
Not only the arrow signs, but also alert triggers when the star sign lights up for the first time have become possible.
Additionally,4K monitor support now allows you to display the arrows and stars even larger.
For details, please see the article below on Investment Navi+.
About the version upgrade of the major indicators of mBDSR
https://www.gogojungle.co.jp/finance/navi/articles/69373
In recent Investment Navi+ articles,many examples illustrating the strong compatibility between various trading methods and mBDSR signalsare introduced.
USDCAD 1-hour chart
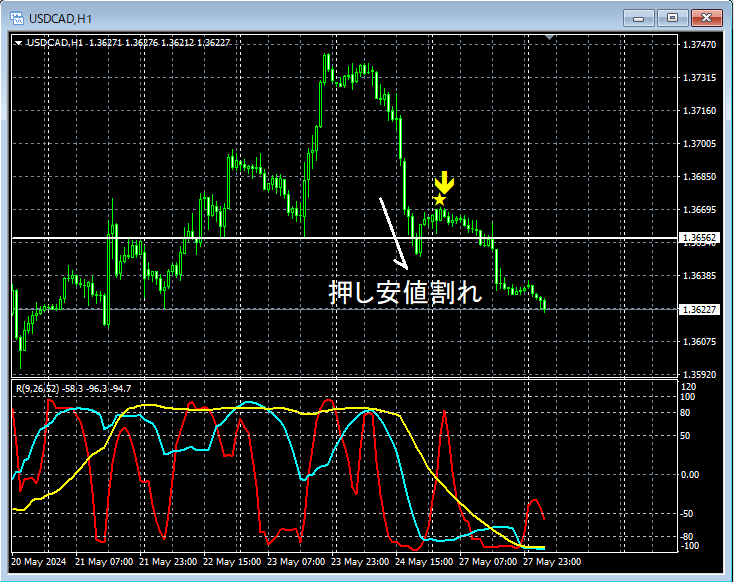
In the 1-hour chart above,a bullish swing low was penetrated, and on the subsequent risethe return-sell signal ofmBDSR (Filter: RCI26 and RCI52)appeared, and price has been declining smoothly thereafter.
From this example,the high compatibility between Dow Theory-based trading methodsandmBDSR signalsis evident.
Indicators that shine in combination with RCI: 【BODSOR・mBDSR】
with methods and case studies (PDF) ★GogoJungle AWARD 2020 WINNER★
https://www.gogojungle.co.jp/tools/indicators/11836
The PDF file includes 301 items (over 1,000 pages, over 350,000 characters in total).
Many of them are structured as examples that logically link higher and lower timeframes using three RCI lines, and ultimately approach waiting for a buying opportunity on pullbacks or a selling opportunity on rallies in lower timeframes (i.e., mBDSR signals).Additionally,
there is a focus on identifying points where multiple entry reasons overlap.There are many such cases.
The explanations usemore than 1,000 charts..

Not only the arrow signs, but also alert triggers when the star sign lights up for the first time have become possible.
Additionally,4K monitor support now allows you to display the arrows and stars even larger.
For details, please see the article below on Investment Navi+.
About the version upgrade of the major indicators of mBDSR
https://www.gogojungle.co.jp/finance/navi/articles/69373
In recent Investment Navi+ articles,many examples illustrating the strong compatibility between various trading methods and mBDSR signalsare introduced.
USDCAD 1-hour chart
In the 1-hour chart above,a bullish swing low was penetrated, and on the subsequent risethe return-sell signal ofmBDSR (Filter: RCI26 and RCI52)appeared, and price has been declining smoothly thereafter.
From this example,the high compatibility between Dow Theory-based trading methodsandmBDSR signalsis evident.
Indicators that shine in combination with RCI: 【BODSOR・mBDSR】
with methods and case studies (PDF) ★GogoJungle AWARD 2020 WINNER★
https://www.gogojungle.co.jp/tools/indicators/11836
The PDF file includes 301 items (over 1,000 pages, over 350,000 characters in total).
Many of them are structured as examples that logically link higher and lower timeframes using three RCI lines, and ultimately approach waiting for a buying opportunity on pullbacks or a selling opportunity on rallies in lower timeframes (i.e., mBDSR signals).Additionally,
there is a focus on identifying points where multiple entry reasons overlap.There are many such cases.
The explanations usemore than 1,000 charts..
× ![]()


