

Triangle consolidation pattern and signs of R1 R2 S2 example
※【R1R2S2】 Detailed explanation abouthere.
AUD/JPY 15-minute chart
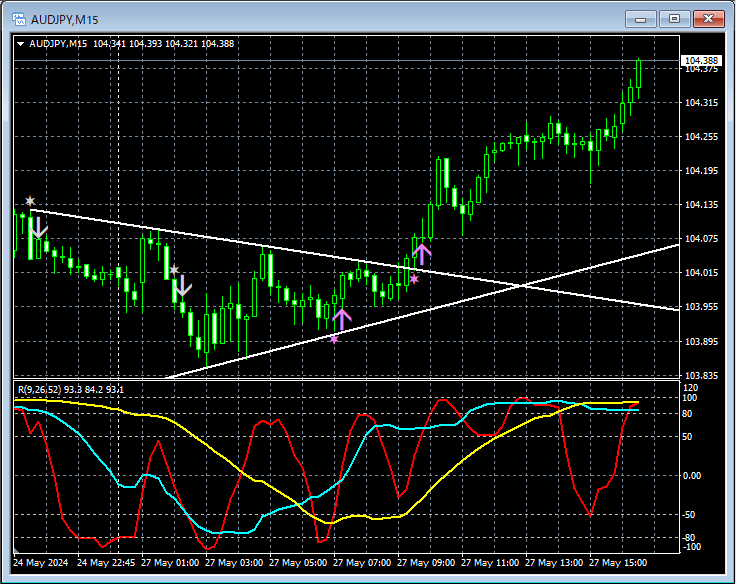
Above on the 15-minute chart,Triangle consolidationsignals lit upR1R2S2signs are shown. In particular,triangle consolidationsignals lit up when breaking out upward are noteworthy.
From this example,a trading method focused on triangle consolidationandR1R2S2 signalsshow a high degree of compatibility.
An indicator that shines in combination with RCI【BODSOR・mBDSR】
and methodology / case studies (PDF) ★GogoJungle AWARD 2020 winner★
https://www.gogojungle.co.jp/tools/indicators/11836
The PDF file includes 301 files (over 1,000 pages, over 350,000 characters in total).
Many of them aresummaries of examples that logically link higher and lower timeframes using three RCI lines to consider various conditions across multiple lower timeframes, ultimately waiting for the timing to buy the dip or sell the rally on the lower timeframe (i.e., the sign of mBDSR).
Also,many emphasize identifying points where multiple entry reasons coincide.
In the explanationsmore than 1,000 chartsare used.

× ![]()


