

Double top neckline and mBDSR (RCI 2-band filter) bearish signal
※On May 4, 2024,Upgrade of major indicators for [mBDSR]was carried out.
Not only the arrow sign, but also at the first lighting of the star sign, alerts can now be generated.
Also,4K monitor supportallows the arrow and star signs to be displayed even larger.
For details, please refer to the article below in Investment Navi+.
About the version upgrade of major indicators for 【mBDSR】
https://www.gogojungle.co.jp/finance/navi/articles/69373
In recent Investment Navi+ articles,there are many examples showing the high compatibility between various trading methods and mBDSR signalsso you can see.
USD/JPY 5-minute chart
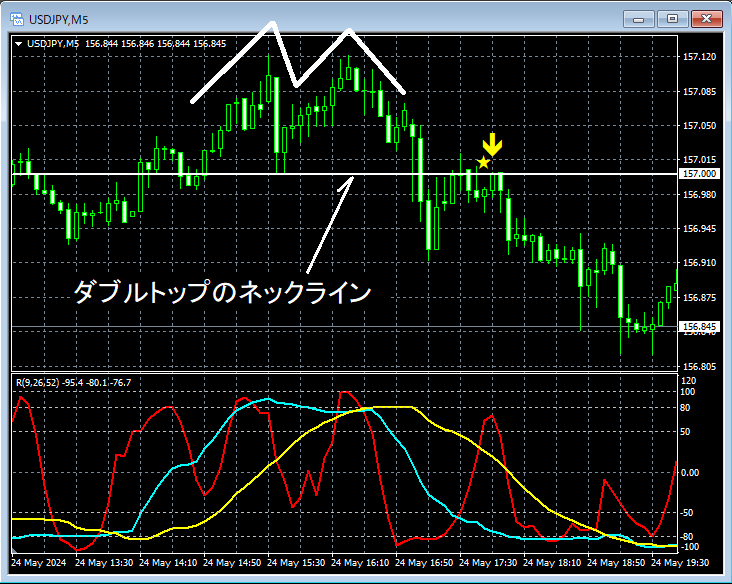
In the above 5-minute chart,neckline of the double toprises to near the regionmBDSR (Filter: RCI26 and RCI52)reversal sell signal lights up, and afterward, price declines steadily.
From this example,a trading method focusing on the double top and its necklineandmBDSR signalsshow high compatibility.
Indicators that shine when combined with RCI — 【BODSOR・mBDSR】
and methods & case studies (PDF) ★GogoJungle AWARD2020 winner★
https://www.gogojungle.co.jp/tools/indicators/11836
The PDF file includes 301 documents (over 1,000 pages, over 350,000 characters in total).
Most of them are aboutexplaining how to logically link higher and lower timeframes using three RCI lines, sequentially examining the status of multiple lower timeframes, and ultimately waiting for timing to buy the dips or sell rallies on the lower timeframe (i.e., mBDSR signals).This is the gist.
Also,many entries focus on points where multiple entry grounds overlap..
In the explanations,more than 1,000 chartsare used.

Not only the arrow sign, but also at the first lighting of the star sign, alerts can now be generated.
Also,4K monitor supportallows the arrow and star signs to be displayed even larger.
For details, please refer to the article below in Investment Navi+.
About the version upgrade of major indicators for 【mBDSR】
https://www.gogojungle.co.jp/finance/navi/articles/69373
In recent Investment Navi+ articles,there are many examples showing the high compatibility between various trading methods and mBDSR signalsso you can see.
USD/JPY 5-minute chart
In the above 5-minute chart,neckline of the double toprises to near the regionmBDSR (Filter: RCI26 and RCI52)reversal sell signal lights up, and afterward, price declines steadily.
From this example,a trading method focusing on the double top and its necklineandmBDSR signalsshow high compatibility.
Indicators that shine when combined with RCI — 【BODSOR・mBDSR】
and methods & case studies (PDF) ★GogoJungle AWARD2020 winner★
https://www.gogojungle.co.jp/tools/indicators/11836
The PDF file includes 301 documents (over 1,000 pages, over 350,000 characters in total).
Most of them are aboutexplaining how to logically link higher and lower timeframes using three RCI lines, sequentially examining the status of multiple lower timeframes, and ultimately waiting for timing to buy the dips or sell rallies on the lower timeframe (i.e., mBDSR signals).This is the gist.
Also,many entries focus on points where multiple entry grounds overlap..
In the explanations,more than 1,000 chartsare used.
× ![]()


