

Buy signal on the resistance line and mBDSR (RCI2 double filter)
※May 4, 2024【mBDSR】 Major indicators up-versionhave been updated.
Alerts can now be triggered not only for the arrow sign but also when the star sign first lights up.
Additionally,4K monitor supportallows the arrow and star signs to be displayed even larger.
For details, please see the following investment navigation+ article.
About the version upgrade of the major indicators for mBDSR
https://www.gogojungle.co.jp/finance/navi/articles/69373
NZDUSD 5-minute chart
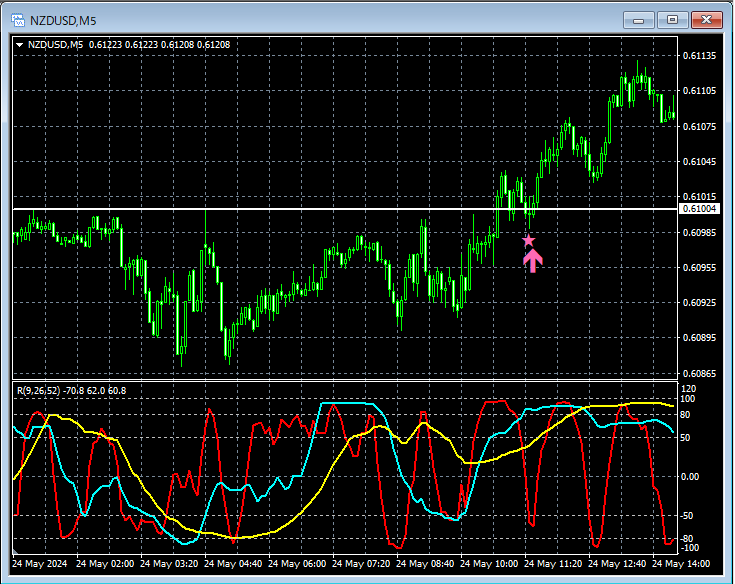
On the 5-minute chart above,the line that acted as resistancewas broken to the downside,mBDSR (RCI two-filter) pullback buy signallit up, and subsequently the price rose steadily.
The chart is omitted, but on the 1-hour timeframe,an inverted head and shoulderscan also be interpreted as a pullback buy signal on the 5-minute chart after formation.
From this example,a trading method focusing on inverted head and shoulders and resistance linesandthe signals of mBDSRshow a high degree of harmony.
Indicators that combine powerful with RCI: 【BODSOR・mBDSR】
and method & case studies (PDF) ★GogoJungle AWARD 2020 Winner★
https://www.gogojungle.co.jp/tools/indicators/11836
The PDF file contains 301 documents (over 1,000 pages, over 350,000 characters in total).
Many of them summarize examples that use three RCI lines to logically link higher and lower timeframes, examining multiple lower-timeframe conditions sequentially, ultimately waiting for pullbacks or returns signals on the lower timeframe (i.e., mBDSR signals).
Also,many focus on identifying points where multiple entry reasons overlap..
In the explanations,over 1,000 chartsare used.

Alerts can now be triggered not only for the arrow sign but also when the star sign first lights up.
Additionally,4K monitor supportallows the arrow and star signs to be displayed even larger.
For details, please see the following investment navigation+ article.
About the version upgrade of the major indicators for mBDSR
https://www.gogojungle.co.jp/finance/navi/articles/69373
NZDUSD 5-minute chart
On the 5-minute chart above,the line that acted as resistancewas broken to the downside,mBDSR (RCI two-filter) pullback buy signallit up, and subsequently the price rose steadily.
The chart is omitted, but on the 1-hour timeframe,an inverted head and shoulderscan also be interpreted as a pullback buy signal on the 5-minute chart after formation.
From this example,a trading method focusing on inverted head and shoulders and resistance linesandthe signals of mBDSRshow a high degree of harmony.
Indicators that combine powerful with RCI: 【BODSOR・mBDSR】
and method & case studies (PDF) ★GogoJungle AWARD 2020 Winner★
https://www.gogojungle.co.jp/tools/indicators/11836
The PDF file contains 301 documents (over 1,000 pages, over 350,000 characters in total).
Many of them summarize examples that use three RCI lines to logically link higher and lower timeframes, examining multiple lower-timeframe conditions sequentially, ultimately waiting for pullbacks or returns signals on the lower timeframe (i.e., mBDSR signals).
Also,many focus on identifying points where multiple entry reasons overlap..
In the explanations,over 1,000 chartsare used.
× ![]()


