

Third attempt at the low and a buy signal on pullback with mBDSR (RCI two-filter)
※On May 4, 2024A Version Upgrade for Major Indicators of 【mBDSR】was carried out.
Alerts can now be triggered not only for arrow signs but also at the first illumination of star signs.
Also,4K monitor supportallows the arrows and stars to be displayed even larger.
For details, please see the article below on Investment Navigator+.
Upgrading the major indicators of the 【mBDSR】
https://www.gogojungle.co.jp/finance/navi/articles/69373
Euro/AUD 4-hour chart
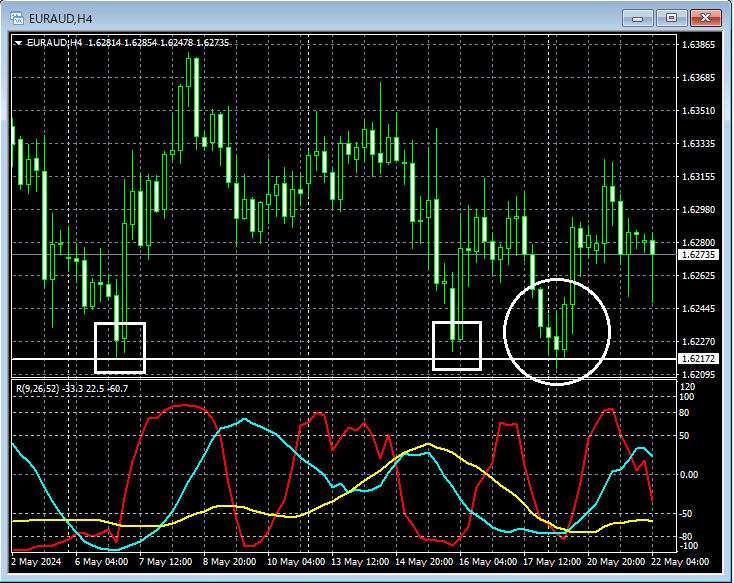
In the area circled with a white circle on the above 4-hour chart,the support linehas been pushed down toward.Third low attemptand,if the support lineis clearly broken down, there is a potential for a larger decline, but ifthe support lineholds and rebounds, there could be a sizable rise. First,watch for a clear break of the support lineand consider buying on dips.
Euro-AUD 15-minute chart
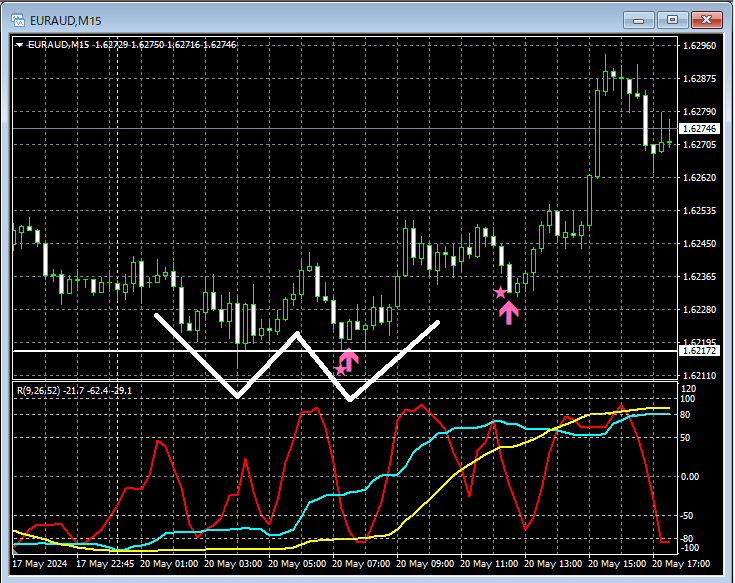
On the above 15-minute chart,the support lineis near and forms adouble bottomDouble bottomIn the right valley,the mBDSR (RCI two-filter) dip-buy signallights up. Subsequently, price rises steadily. Notably, even during the rise, anothermBDSR (RCI two-filter) dip-buy signal lights up.
From this example,a trading approach focusing on the third low or double bottomandthe mBDSR signalsshow strong compatibility.
Indicators that excel when combined with RCI: 【BODSOR・mBDSR】
and technique/case studies (PDF) ★GogoJungle AWARD 2020 winner★
https://www.gogojungle.co.jp/tools/indicators/11836
The PDF file includes 301 files (over 1,000 pages, over 350,000 characters in total).
Many of these illustrate an approach that logically links higher and lower timeframes using three RCI lines to examine multiple lower-timeframe situations sequentially, ultimately waiting for dip-buying timing or pullback selling on the lower timeframes (i.e., the mBDSR signals).
Additionally,many emphasize identifying points where multiple entry reasons converge..
The explanation usesover 1,000 charts.

Alerts can now be triggered not only for arrow signs but also at the first illumination of star signs.
Also,4K monitor supportallows the arrows and stars to be displayed even larger.
For details, please see the article below on Investment Navigator+.
Upgrading the major indicators of the 【mBDSR】
https://www.gogojungle.co.jp/finance/navi/articles/69373
Euro/AUD 4-hour chart
In the area circled with a white circle on the above 4-hour chart,the support linehas been pushed down toward.Third low attemptand,if the support lineis clearly broken down, there is a potential for a larger decline, but ifthe support lineholds and rebounds, there could be a sizable rise. First,watch for a clear break of the support lineand consider buying on dips.
Euro-AUD 15-minute chart
On the above 15-minute chart,the support lineis near and forms adouble bottomDouble bottomIn the right valley,the mBDSR (RCI two-filter) dip-buy signallights up. Subsequently, price rises steadily. Notably, even during the rise, anothermBDSR (RCI two-filter) dip-buy signal lights up.
From this example,a trading approach focusing on the third low or double bottomandthe mBDSR signalsshow strong compatibility.
Indicators that excel when combined with RCI: 【BODSOR・mBDSR】
and technique/case studies (PDF) ★GogoJungle AWARD 2020 winner★
https://www.gogojungle.co.jp/tools/indicators/11836
The PDF file includes 301 files (over 1,000 pages, over 350,000 characters in total).
Many of these illustrate an approach that logically links higher and lower timeframes using three RCI lines to examine multiple lower-timeframe situations sequentially, ultimately waiting for dip-buying timing or pullback selling on the lower timeframes (i.e., the mBDSR signals).
Additionally,many emphasize identifying points where multiple entry reasons converge..
The explanation usesover 1,000 charts.
× ![]()


