

Third attempt at the high price and support-resistance turn and mBDSR (RCI two-line filter) dip-buy signal
※On May 4, 2024,Version upgrade of the main indicators for 【mBDSR】was carried out.
Not only arrow signs, but alerts can also be triggered when the star sign lights up for the first time.
Also,4K monitor supportallows the arrow and star signs to be displayed even larger.
For details, please read the article below on Investment Navi+.
About the version upgrade of the main indicators of 【mBDSR】
https://www.gogojungle.co.jp/finance/navi/articles/69373
USD/JPY 1-hour chart
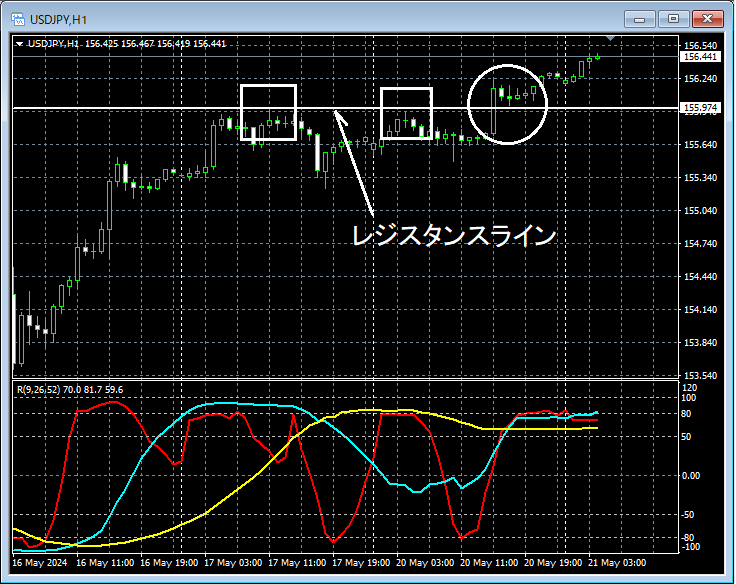
In the 1-hour chart above,the resistance linehas been broken upward on the third attempt, so it might not be strange to look for pullback buying on lower timeframes.
USD/JPY 15-minute chart
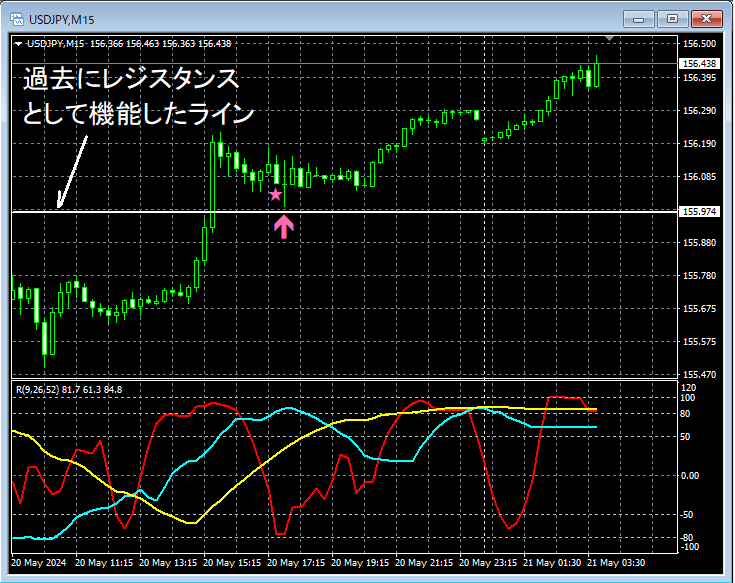
In the 15-minute chart above,the line that previously functioned as resistancehas fallen toward near that area,the pullback buying signal of mBDSR (RCI two-filter)has lit up, and subsequently price has risen steadily. This is the so-calledbreakthrough from resistance to supportrise.
From this example,the trading method focused on the third high attempt and resistance-support breakand thesignal of mBDSRshow high compatibility.
Indicators that excel in combination with RCI: 【BODSOR・mBDSR】
and techniques / case studies (PDF) ★GogoJungle AWARD2020 winner★
https://www.gogojungle.co.jp/tools/indicators/11836
The PDF files number 301 (over 1,000 pages total, over 350,000 characters total).
Most of them areexamples that break down how to link multiple lower timeframes logically using three RCI lines to the higher timeframes, ultimately waiting for pullbacks or reversals on the lower timeframes (i.e., mBDSR signals)..
Also,many focus on capturing points where multiple entry reasons overlap.
In the explanations,more than 1,000 chartshave been used.

Not only arrow signs, but alerts can also be triggered when the star sign lights up for the first time.
Also,4K monitor supportallows the arrow and star signs to be displayed even larger.
For details, please read the article below on Investment Navi+.
About the version upgrade of the main indicators of 【mBDSR】
https://www.gogojungle.co.jp/finance/navi/articles/69373
USD/JPY 1-hour chart
In the 1-hour chart above,the resistance linehas been broken upward on the third attempt, so it might not be strange to look for pullback buying on lower timeframes.
USD/JPY 15-minute chart
In the 15-minute chart above,the line that previously functioned as resistancehas fallen toward near that area,the pullback buying signal of mBDSR (RCI two-filter)has lit up, and subsequently price has risen steadily. This is the so-calledbreakthrough from resistance to supportrise.
From this example,the trading method focused on the third high attempt and resistance-support breakand thesignal of mBDSRshow high compatibility.
Indicators that excel in combination with RCI: 【BODSOR・mBDSR】
and techniques / case studies (PDF) ★GogoJungle AWARD2020 winner★
https://www.gogojungle.co.jp/tools/indicators/11836
The PDF files number 301 (over 1,000 pages total, over 350,000 characters total).
Most of them areexamples that break down how to link multiple lower timeframes logically using three RCI lines to the higher timeframes, ultimately waiting for pullbacks or reversals on the lower timeframes (i.e., mBDSR signals)..
Also,many focus on capturing points where multiple entry reasons overlap.
In the explanations,more than 1,000 chartshave been used.
× ![]()


