

2B Reversal and mBDSR (RCI2 Bandpass Filter) Buy Signal
※On May 4, 2024,Upgrade of the main indicators of mBDSRwas implemented.
Not only the arrow signs, but also alerts can be triggered when the star sign lights up for the first time.
Also,4K monitor supportallows the arrows and stars to be displayed even larger.
Please see the article below in Investment Navi+ for details.
About the version upgrade of the main indicators of mBDSR
https://www.gogojungle.co.jp/finance/navi/articles/69373
In recent Investment Navi+ articles,many examples show the compatibility between various trading methods and mBDSR signalsto help you understand their compatibility.
EURCAD 1-hour chart
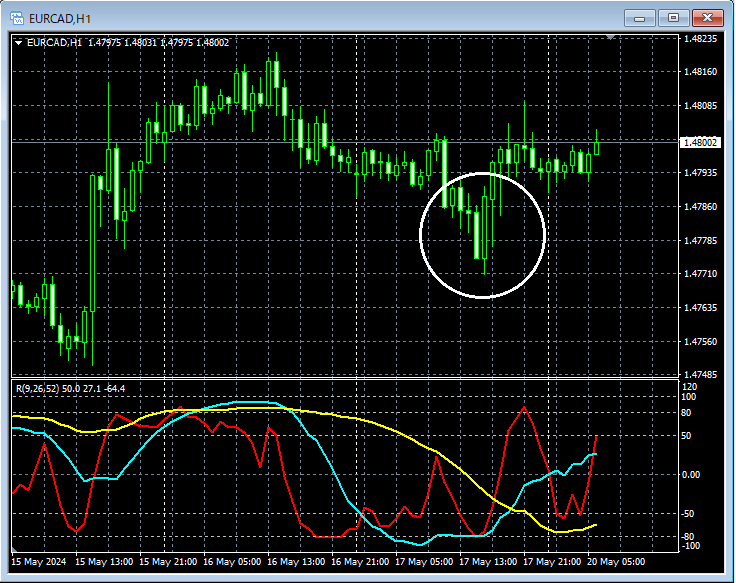
In the 1-hour chart above, when looking at the area circled in white, a bullish indicationTwo-bar reversalappears. It might not be strange to consider a pullback buy on a lower timeframe.
EURCAD 5-minute chart
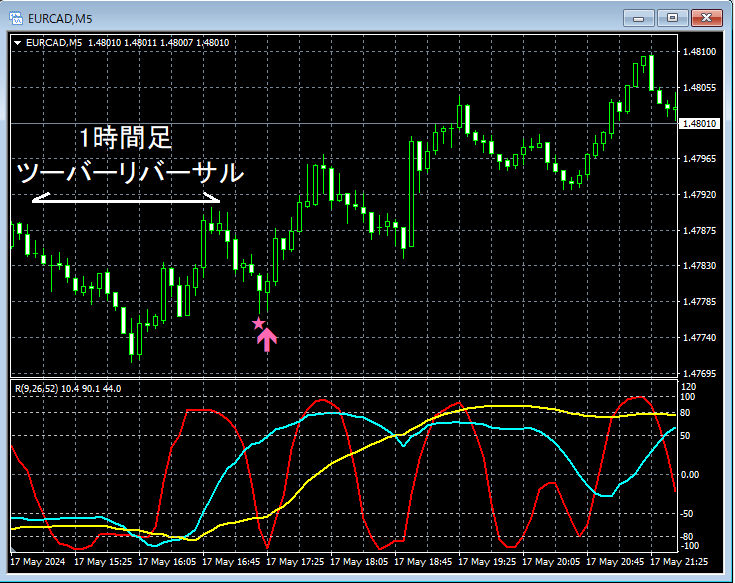
In the 5-minute chart above, on the 1-hour chartTwo-bar reversal (2B reversal)mBDSR (Filter: RCI26 and RCI52) pullback buy signallights up and rises.
From this example,the trading method focusing on the Two-bar reversal (2B reversal)andthe signals of mBDSRshow a high degree of compatibility.
Indicators that are powerful when combined with RCI: 【BODSOR・mBDSR】
and technique and case studies (PDF) ★GogoJungle AWARD2020 winner★
https://www.gogojungle.co.jp/tools/indicators/11836
260 PDF files are included.Many of them illustrate the process of logically linking higher and lower timeframes using three RCI lines, examining multiple lower-timeframe situations sequentially, and ultimately waiting for pullback buys or pullback sells on the lower timeframes (i.e., mBDSR signals).The explanations useover 1,000 charts in total.

Not only the arrow signs, but also alerts can be triggered when the star sign lights up for the first time.
Also,4K monitor supportallows the arrows and stars to be displayed even larger.
Please see the article below in Investment Navi+ for details.
About the version upgrade of the main indicators of mBDSR
https://www.gogojungle.co.jp/finance/navi/articles/69373
In recent Investment Navi+ articles,many examples show the compatibility between various trading methods and mBDSR signalsto help you understand their compatibility.
EURCAD 1-hour chart
In the 1-hour chart above, when looking at the area circled in white, a bullish indicationTwo-bar reversalappears. It might not be strange to consider a pullback buy on a lower timeframe.
EURCAD 5-minute chart
In the 5-minute chart above, on the 1-hour chartTwo-bar reversal (2B reversal)mBDSR (Filter: RCI26 and RCI52) pullback buy signallights up and rises.
From this example,the trading method focusing on the Two-bar reversal (2B reversal)andthe signals of mBDSRshow a high degree of compatibility.
Indicators that are powerful when combined with RCI: 【BODSOR・mBDSR】
and technique and case studies (PDF) ★GogoJungle AWARD2020 winner★
https://www.gogojungle.co.jp/tools/indicators/11836
260 PDF files are included.Many of them illustrate the process of logically linking higher and lower timeframes using three RCI lines, examining multiple lower-timeframe situations sequentially, and ultimately waiting for pullback buys or pullback sells on the lower timeframes (i.e., mBDSR signals).The explanations useover 1,000 charts in total.
× ![]()


