

Price action support turn, double bottom, counter-trend line, and mBDSR (RCI two-line filter) pullback buying signal
※On May 4, 2024Upgrading the main indicators of 【mBDSR】 has been performed.
Not only arrow signs, but also alert triggers when the star sign lights up for the first time are now possible.
Also,4K monitor support allows the arrows and stars to be displayed even larger.
For details, please read the article below from Investment Navi+.
About the version upgrade of the main indicators of mBDSR
https://www.gogojungle.co.jp/finance/navi/articles/69373
EUR/CHF 5-minute chart
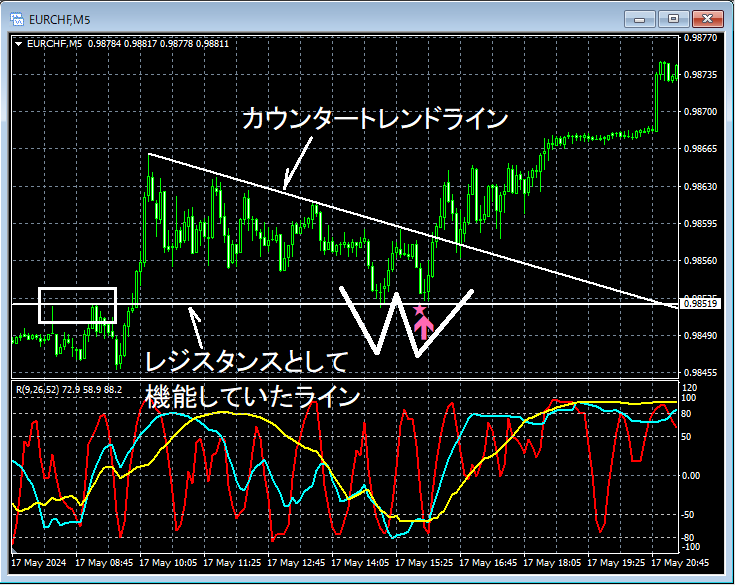
In the 5-minute chart above,the line that previously acted as resistancehas been pulled down toward the vicinity of whicha double bottomis formed and has rebounded.Double bottomon the right valleymBDSR (RCI two-filter) buy-the-dip signallights up as the price rises.Counter-trend lineis broken above, and the price continues to rise.
From this example,a trading method focusing on resistance/support turns, double bottoms, and counter-trend linesandmBDSR signalsshow strong compatibility.
Indicators that excel in combination with RCI: 【BODSOR・mBDSR】
and their method & case studies (PDF) ★GogoJungle AWARD 2020 Winner★
https://www.gogojungle.co.jp/tools/indicators/11836
The PDF file includes 301 documents (over 1,000 pages, over 350,000 characters in total).
Many of them are examples that break down how, by linking higher and lower timeframes logically using three RCI lines, the multiple lower-timeframe conditions are analyzed successively, ultimately waiting for a pullback buy or pullback sell timing (i.e., the mBDSR signal) on the lower timeframe.
Also,many of them focus on capturing points where multiple entry reasons coincide..
In the explanations,over 1,000 chartsare used.

Not only arrow signs, but also alert triggers when the star sign lights up for the first time are now possible.
Also,4K monitor support allows the arrows and stars to be displayed even larger.
For details, please read the article below from Investment Navi+.
About the version upgrade of the main indicators of mBDSR
https://www.gogojungle.co.jp/finance/navi/articles/69373
EUR/CHF 5-minute chart
In the 5-minute chart above,the line that previously acted as resistancehas been pulled down toward the vicinity of whicha double bottomis formed and has rebounded.Double bottomon the right valleymBDSR (RCI two-filter) buy-the-dip signallights up as the price rises.Counter-trend lineis broken above, and the price continues to rise.
From this example,a trading method focusing on resistance/support turns, double bottoms, and counter-trend linesandmBDSR signalsshow strong compatibility.
Indicators that excel in combination with RCI: 【BODSOR・mBDSR】
and their method & case studies (PDF) ★GogoJungle AWARD 2020 Winner★
https://www.gogojungle.co.jp/tools/indicators/11836
The PDF file includes 301 documents (over 1,000 pages, over 350,000 characters in total).
Many of them are examples that break down how, by linking higher and lower timeframes logically using three RCI lines, the multiple lower-timeframe conditions are analyzed successively, ultimately waiting for a pullback buy or pullback sell timing (i.e., the mBDSR signal) on the lower timeframe.
Also,many of them focus on capturing points where multiple entry reasons coincide..
In the explanations,over 1,000 chartsare used.
× ![]()


