

Candlestick with a long lower wick, the Japanese Sachidan (Sakata Gohou) signal "Morning Star" and the mBDSR (RCI two-filter) pullback buying signal
0
New!!※On May 4, 2024Upgrade of the main indicators of 【mBDSR】has been implemented.
Not only arrow signs, but also the first-time appearance of star signs now trigger alerts.
Also,4K monitor optimizationallows even larger display of arrows and star signs.
Please refer to the article below on Investment Navigator+ for details.
About the version upgrade of the main indicators of mBDSR
https://www.gogojungle.co.jp/finance/navi/articles/69373
In recent Investment Navigator+ articles,many examples show the high compatibility between various trading methods and mBDSR signalsto illustrate this.
Dollar/Yen 15-minute chart
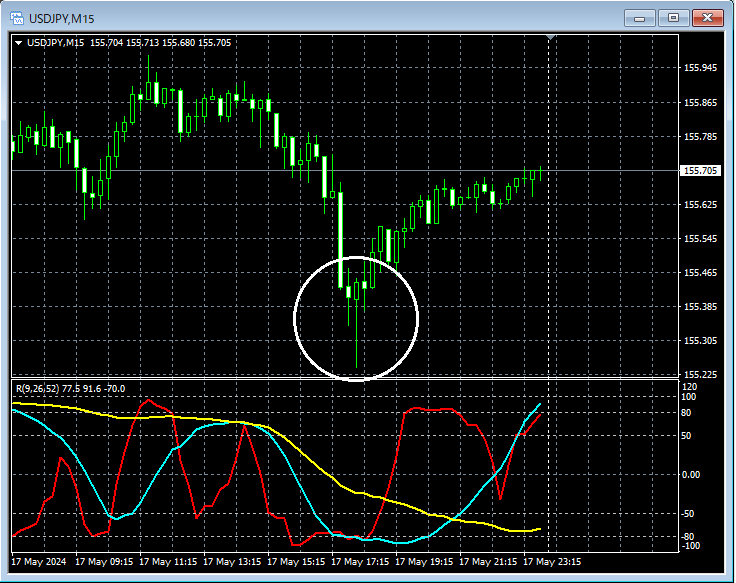
Looking at the area circled in white on the 15-minute chart above, it suggests a riselong lower shadow candlestickappears. It may be a good setup to consider buying on a pullback on a lower time frame.
Dollar/Yen 5-minute chart
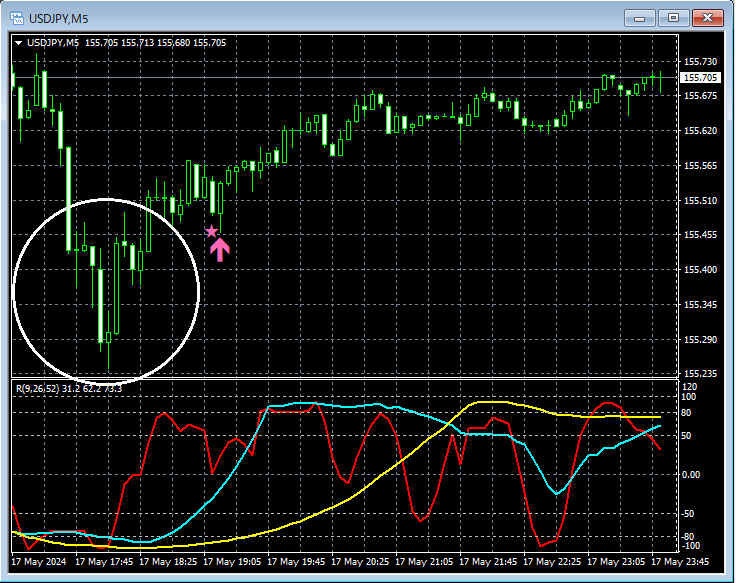
In the upper 5-minute chartSakata’s Five Methods “Morning Star”(a near-form)mBDSR (Filter: RCI26 and RCI52) pullback buy signallights up and rises.
From this example,a trading method that focuses on long lower shadows or Sakata’s Five Methods “Morning Star”andmBDSR signalshave a strong compatibility.
Indicators that excel when combined with RCI: 【BODSOR・mBDSR】
and techniques/case studies (PDF) ★GogoJungle AWARD 2020 winner★
https://www.gogojungle.co.jp/tools/indicators/11836
260 PDF files are included.Many of them demonstrate how to logically link higher and lower timeframes using three RCI lines, systematically examine multiple lower-timeframe situations, and ultimately time purchases on dips or sells on rallies (i.e., waiting for mBDSR signals). The explanations useover 1,000 chartsin total.

Not only arrow signs, but also the first-time appearance of star signs now trigger alerts.
Also,4K monitor optimizationallows even larger display of arrows and star signs.
Please refer to the article below on Investment Navigator+ for details.
About the version upgrade of the main indicators of mBDSR
https://www.gogojungle.co.jp/finance/navi/articles/69373
In recent Investment Navigator+ articles,many examples show the high compatibility between various trading methods and mBDSR signalsto illustrate this.
Dollar/Yen 15-minute chart
Looking at the area circled in white on the 15-minute chart above, it suggests a riselong lower shadow candlestickappears. It may be a good setup to consider buying on a pullback on a lower time frame.
Dollar/Yen 5-minute chart
In the upper 5-minute chartSakata’s Five Methods “Morning Star”(a near-form)mBDSR (Filter: RCI26 and RCI52) pullback buy signallights up and rises.
From this example,a trading method that focuses on long lower shadows or Sakata’s Five Methods “Morning Star”andmBDSR signalshave a strong compatibility.
Indicators that excel when combined with RCI: 【BODSOR・mBDSR】
and techniques/case studies (PDF) ★GogoJungle AWARD 2020 winner★
https://www.gogojungle.co.jp/tools/indicators/11836
260 PDF files are included.Many of them demonstrate how to logically link higher and lower timeframes using three RCI lines, systematically examine multiple lower-timeframe situations, and ultimately time purchases on dips or sells on rallies (i.e., waiting for mBDSR signals). The explanations useover 1,000 chartsin total.
× ![]()


