

Counter Trend Line, Double Bottom, and mBDSR (RCI 2 lines) Buy Signal
New!!※On May 4, 2024About the major indicators of 【mBDSR】 version upgradehas been carried out.
Not only the arrow signs, but also when the star sign lights up for the first time, alerts are now possible.
Also,4k monitor対応By displaying the arrows and stars even larger, it is possible.
Please see the article below in Investment Navi+ for details.
About the version upgrade of the major indicators of mBDSR
https://www.gogojungle.co.jp/finance/navi/articles/69373
USDCAD 5-minute chart
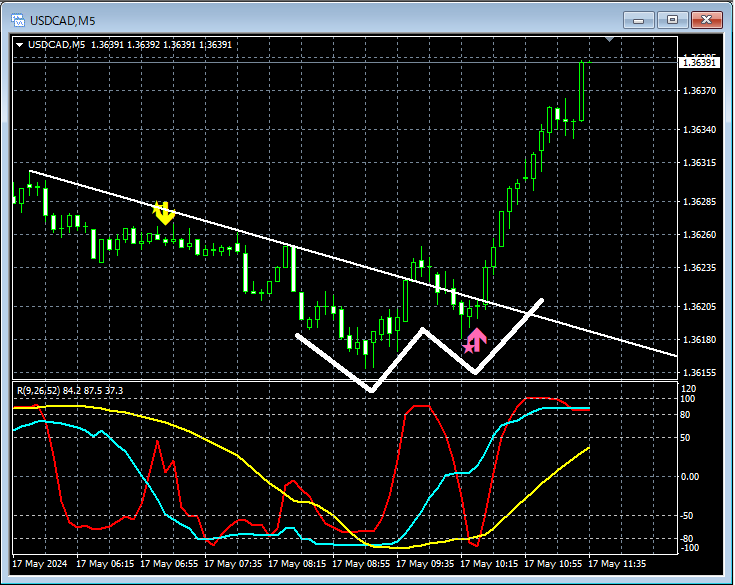
On the 5-minute chart above,Counter-trend lineAfter breaking above, in the pullbackmBDSR (RCI two-line filter) buy signallights up, and subsequently, the price rises steadily.
As a result,a double bottomsignals light up at the valley on the right side.
From this example,a trading approach focusing on counter-trend lines and double bottomsandthe harmony with mBDSR signalsare evident.
The indicator 【BODSOR・mBDSR】 that shines in combination with RCI,
and its method and case study (PDF) ★GogoJungle AWARD2020 winner★
https://www.gogojungle.co.jp/tools/indicators/11836
The PDF file includes 301 items (over 1,000 pages, over 350,000 characters in total).
Most of them areexamples that link multiple higher and lower timeframes logically using three RCI lines, concluding with timing for pullbacks or reversals on the lower timeframe (= mBDSR signals)..
Additionally,there are many that emphasize identifying points where multiple entry criteria overlap..
In the explanation,more than 1,000 chartsare used.

Not only the arrow signs, but also when the star sign lights up for the first time, alerts are now possible.
Also,4k monitor対応By displaying the arrows and stars even larger, it is possible.
Please see the article below in Investment Navi+ for details.
About the version upgrade of the major indicators of mBDSR
https://www.gogojungle.co.jp/finance/navi/articles/69373
USDCAD 5-minute chart
On the 5-minute chart above,Counter-trend lineAfter breaking above, in the pullbackmBDSR (RCI two-line filter) buy signallights up, and subsequently, the price rises steadily.
As a result,a double bottomsignals light up at the valley on the right side.
From this example,a trading approach focusing on counter-trend lines and double bottomsandthe harmony with mBDSR signalsare evident.
The indicator 【BODSOR・mBDSR】 that shines in combination with RCI,
and its method and case study (PDF) ★GogoJungle AWARD2020 winner★
https://www.gogojungle.co.jp/tools/indicators/11836
The PDF file includes 301 items (over 1,000 pages, over 350,000 characters in total).
Most of them areexamples that link multiple higher and lower timeframes logically using three RCI lines, concluding with timing for pullbacks or reversals on the lower timeframe (= mBDSR signals)..
Additionally,there are many that emphasize identifying points where multiple entry criteria overlap..
In the explanation,more than 1,000 chartsare used.
× ![]()


