

Translate the below html to English, keep format html, the result is not in markdown code and not break line, convert standard decode before translate: Upper foot/standing leg appears strong situation mBDSR (RCI 2-band filter) buy signal
0
New!!※On May 4, 2024Upgrade of major indicators in【mBDSR】has been performed.
Not only the arrow signs but also the star signs light up with alerts when they first appear.
Also,4K monitor supporthas been added to display arrows and stars even larger.
For details, please read the article below in Invest Navi+.
Upgrade of the major indicators in the mBDSR
https://www.gogojungle.co.jp/finance/navi/articles/69373
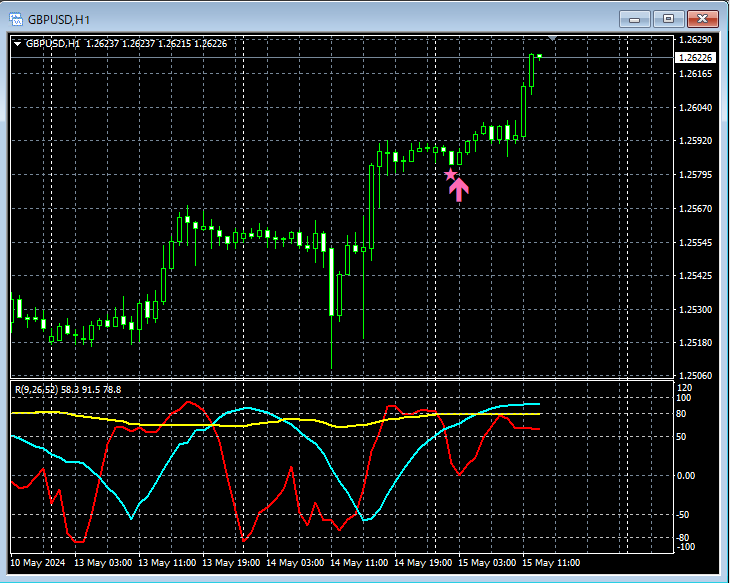
GBPUSD 1-hour chart
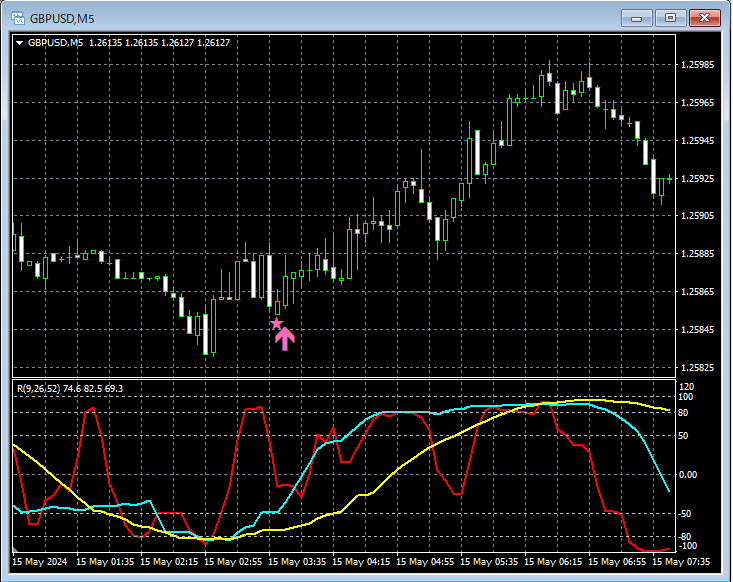
GBPUSD 5-minute chart
The charts are omitted, but on the daily and 4-hour chartsRCI three-lineare all rising in a very strong formation.
In such a situation, on the 1-hour and 5-minute chartsmBDSR (two RCI filter) pullback buy signallights up, and prices then rise.
The signal on the 5-minute chart occurs at the right-side valley of a double bottomDouble bottomas well, which is noteworthy.
From this example,a trading method focusing on RCI three-line and double bottomandthe signal of mBDSRshow a high degree of compatibility.
Indicators that unleash power when combined with RCI:【BODSOR・mBDSR】
and techniques & case studies (PDF) ★GogoJungle AWARD 2020 winner★
https://www.gogojungle.co.jp/tools/indicators/11836
The PDF file includes 301 documents (over 1,000 pages, over 350,000 characters total).
Many of them describe examples that use the three-line RCI to logically link higher and lower timeframes, sequentially examine multiple lower-timeframe situations, and ultimately wait for pullbacks or reversals on the lower timeframes (i.e., mBDSR signals).Also,
many are focused on capturing points where multiple entry rationales overlap..
In the explanations,over 1,000 chartsare used.

Not only the arrow signs but also the star signs light up with alerts when they first appear.
Also,4K monitor supporthas been added to display arrows and stars even larger.
For details, please read the article below in Invest Navi+.
Upgrade of the major indicators in the mBDSR
https://www.gogojungle.co.jp/finance/navi/articles/69373
GBPUSD 1-hour chart
GBPUSD 5-minute chart
The charts are omitted, but on the daily and 4-hour chartsRCI three-lineare all rising in a very strong formation.
In such a situation, on the 1-hour and 5-minute chartsmBDSR (two RCI filter) pullback buy signallights up, and prices then rise.
The signal on the 5-minute chart occurs at the right-side valley of a double bottomDouble bottomas well, which is noteworthy.
From this example,a trading method focusing on RCI three-line and double bottomandthe signal of mBDSRshow a high degree of compatibility.
Indicators that unleash power when combined with RCI:【BODSOR・mBDSR】
and techniques & case studies (PDF) ★GogoJungle AWARD 2020 winner★
https://www.gogojungle.co.jp/tools/indicators/11836
The PDF file includes 301 documents (over 1,000 pages, over 350,000 characters total).
Many of them describe examples that use the three-line RCI to logically link higher and lower timeframes, sequentially examine multiple lower-timeframe situations, and ultimately wait for pullbacks or reversals on the lower timeframes (i.e., mBDSR signals).Also,
many are focused on capturing points where multiple entry rationales overlap..
In the explanations,over 1,000 chartsare used.
× ![]()


