

Pin bar and mBDSR (RCI2 two-filter) short signal
0
New!!※On May 4, 2024Upgrade of the main indicators of 【mBDSR】has been completed.
Not only the arrow signs, but also star signs illuminate alerts when they first light up.
In addition,4K monitor optimizationallows the arrows and stars to be displayed even larger.
Please refer to the article below in Investment Navi+ for details.
Upgrade of the main indicators of 【mBDSR】
https://www.gogojungle.co.jp/finance/navi/articles/69373
In recent Investment Navi+ articles,there are many examples showing the high compatibility between various trading methods and mBDSR signalsthat illustrate this relationship.
GBPUSD Daily
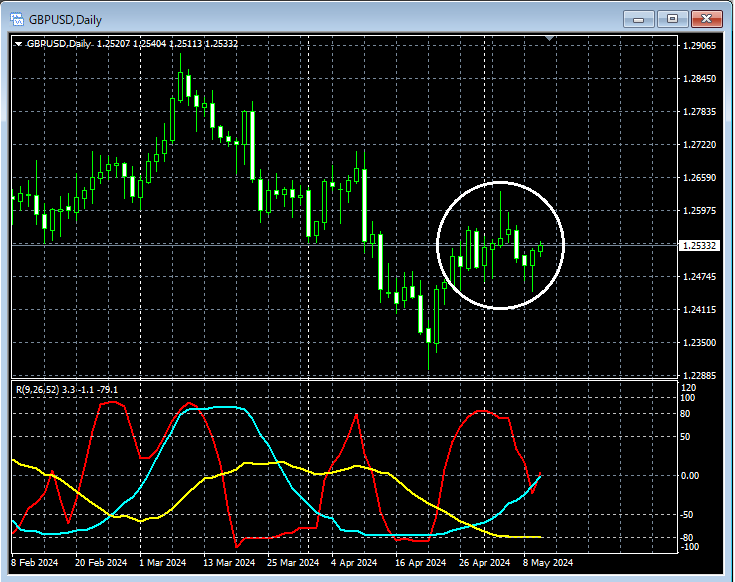
Looking at the area encircled by the white circle on the higher daily chart, there is a candle with a long upper shadow indicating a declinelong upper-shadow bullish candle (pin bar)may suggest a potential decline from here.
GBPUSD 1-Hour
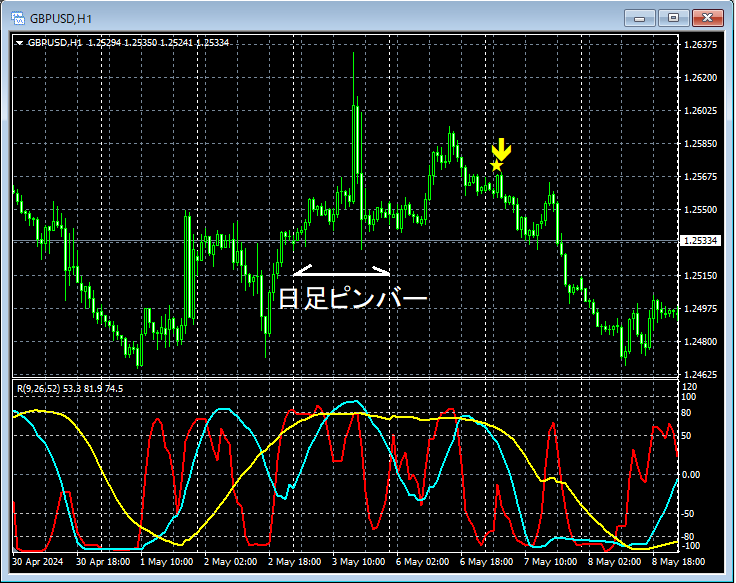
On the 1-hour chart above, on the daily chartpin barappears,mBDSR (filter: RCI26 and RCI52)rebound-sell signal lights up, and subsequently, price has been moving down smoothly.
From this example,a trading method focusing on pin barsandmBDSR signalsshow a high degree of compatibility.
Indicators that excel in combination with RCI: 【BODSOR・mBDSR】
and method studies (PDF) ★GogoJungle AWARD 2020 winner★
https://www.gogojungle.co.jp/tools/indicators/11836
The PDF file contains 301 items (over 1,000 pages, over 350,000 characters in total).
Many of them explain how to logically link higher and lower timeframes using the 3-line RCI, sequentially examining multiple lower-timeframe conditions, and ultimately waiting for pullbacks or bounce entries on the lower timeframe (i.e., mBDSR signals).Additionally,
there are many contents that focus on identifying points where multiple entry reasons overlap..
The explanations useover 1,000 charts.

Not only the arrow signs, but also star signs illuminate alerts when they first light up.
In addition,4K monitor optimizationallows the arrows and stars to be displayed even larger.
Please refer to the article below in Investment Navi+ for details.
Upgrade of the main indicators of 【mBDSR】
https://www.gogojungle.co.jp/finance/navi/articles/69373
In recent Investment Navi+ articles,there are many examples showing the high compatibility between various trading methods and mBDSR signalsthat illustrate this relationship.
GBPUSD Daily
Looking at the area encircled by the white circle on the higher daily chart, there is a candle with a long upper shadow indicating a declinelong upper-shadow bullish candle (pin bar)may suggest a potential decline from here.
GBPUSD 1-Hour
On the 1-hour chart above, on the daily chartpin barappears,mBDSR (filter: RCI26 and RCI52)rebound-sell signal lights up, and subsequently, price has been moving down smoothly.
From this example,a trading method focusing on pin barsandmBDSR signalsshow a high degree of compatibility.
Indicators that excel in combination with RCI: 【BODSOR・mBDSR】
and method studies (PDF) ★GogoJungle AWARD 2020 winner★
https://www.gogojungle.co.jp/tools/indicators/11836
The PDF file contains 301 items (over 1,000 pages, over 350,000 characters in total).
Many of them explain how to logically link higher and lower timeframes using the 3-line RCI, sequentially examining multiple lower-timeframe conditions, and ultimately waiting for pullbacks or bounce entries on the lower timeframe (i.e., mBDSR signals).Additionally,
there are many contents that focus on identifying points where multiple entry reasons overlap..
The explanations useover 1,000 charts.
× ![]()


