

RCI3 Main Line, the Third Wave, Fibonacci Expansion, and mBDSR Signals (2)
0
New!!※On May 4, 2024Major upgrades to the key indicators of 【mBDSR】have been made.
Not only the arrow signs, but also alert triggers when the star sign lights up for the first time are now possible.
Also,4K monitor対応Now the arrows and stars can be displayed even larger.
For details, please see the article below on Investment Navigator+.
Version upgrade of the main indicators for 【mBDSR】
https://www.gogojungle.co.jp/finance/navi/articles/69373
NZDUSD 15-minute chart
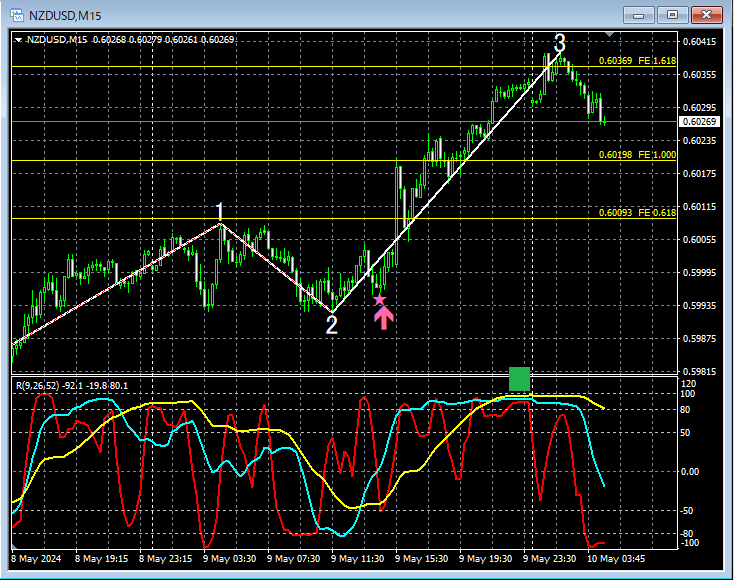
In the 15-minute chart above,early movement of the third waveisan mBDSR (RCI two-line filter) pullback buy signallights up. After that,Fibonacci expansion 1.618around and so-calledthree-line RCI resistancerises to that level.
From this example,the high compatibility between trading methods that focus on the RCI3 lines, the third wave, and Fibonacci expansion,andthe signals of mBDSRis evident.
Indicator that shines when combined with RCI: 【BODSOR・mBDSR】
and its methods & case studies (PDF) ★GogoJungle AWARD2020 winner★
https://www.gogojungle.co.jp/tools/indicators/11836
The PDF file contains 301 documents (over 1,000 pages, over 350,000 words).
Most of these are summaries of examples that break down how to logically link higher and lower timeframes using the three RCI lines, examine the situations across multiple lower timeframes sequentially, and ultimately wait for pullbacks in lower timeframes or retracements selling timing (i.e., mBDSR signals).Additionally,
.
The explanations useover 1,000 charts.

Not only the arrow signs, but also alert triggers when the star sign lights up for the first time are now possible.
Also,4K monitor対応Now the arrows and stars can be displayed even larger.
For details, please see the article below on Investment Navigator+.
Version upgrade of the main indicators for 【mBDSR】
https://www.gogojungle.co.jp/finance/navi/articles/69373
NZDUSD 15-minute chart
In the 15-minute chart above,early movement of the third waveisan mBDSR (RCI two-line filter) pullback buy signallights up. After that,Fibonacci expansion 1.618around and so-calledthree-line RCI resistancerises to that level.
From this example,the high compatibility between trading methods that focus on the RCI3 lines, the third wave, and Fibonacci expansion,andthe signals of mBDSRis evident.
Indicator that shines when combined with RCI: 【BODSOR・mBDSR】
and its methods & case studies (PDF) ★GogoJungle AWARD2020 winner★
https://www.gogojungle.co.jp/tools/indicators/11836
The PDF file contains 301 documents (over 1,000 pages, over 350,000 words).
Most of these are summaries of examples that break down how to logically link higher and lower timeframes using the three RCI lines, examine the situations across multiple lower timeframes sequentially, and ultimately wait for pullbacks in lower timeframes or retracements selling timing (i.e., mBDSR signals).Additionally,
.
The explanations useover 1,000 charts.
× ![]()


