

RCI3 single line and the third wave and Fibonacci expansion and the mBDSR sign (1)
0
New!!※As of May 4, 2024Upgraded the main indicators of 【mBDSR】has been performed.
In addition to the arrow signs, alerts can now be triggered when the star sign lights up for the first time.
Also,4K monitor対応as a result, arrows and stars can be displayed even larger.
For details, please see the article below in Investment Navi+.
About the version upgrade of the main indicators of 【mBDSR】
https://www.gogojungle.co.jp/finance/navi/articles/69373
Euro-OZ, 1-hour chart
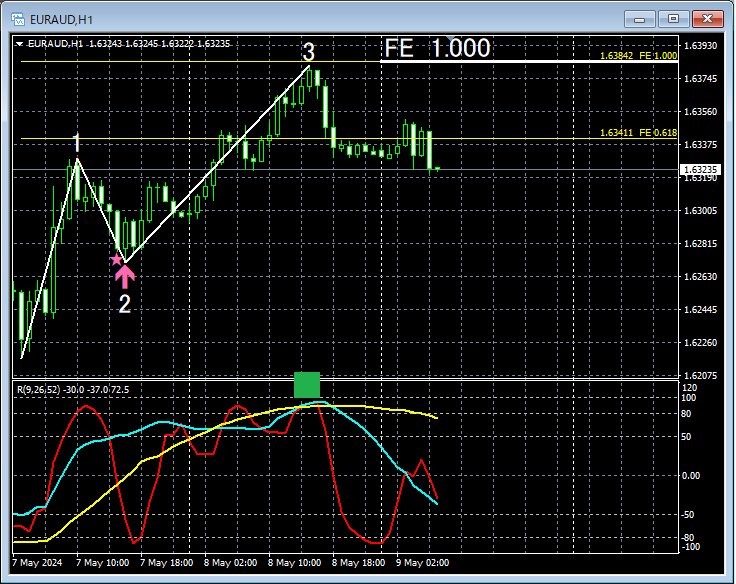
On the above 1-hour chart,the initial move of Wave 3is themBDSR (RCI two-filter) pullback buy signallights up. Subsequently,Fibonacci expansion 1.000and the so-calledRCI triple toprise up to.
From this example,the compatibility between trading methods focused on RCI three lines, Wave 3, and Fibonacci expansionandmBDSR signalsis evident.
Indicators that shine in combination with RCI: 【BODSOR・mBDSR】
and methods/case studies (PDF) ★GogoJungle AWARD2020 winner★
https://www.gogojungle.co.jp/tools/indicators/11836
The PDF file contains 301 items (over 1,000 pages, over 350,000 characters).
Many of them are summarized as examples showing how, by linking multiple higher and lower timeframes logically using the three-line RCI, one examines the conditions of multiple lower timeframes sequentially and ultimately waits for pullbacks (or retracements) timing on the lower timeframes (i.e., mBDSR signals).
Additionally,there are many that focus on identifying points where multiple entry criteria overlap..
The explanation usesover 1,000 charts.

In addition to the arrow signs, alerts can now be triggered when the star sign lights up for the first time.
Also,4K monitor対応as a result, arrows and stars can be displayed even larger.
For details, please see the article below in Investment Navi+.
About the version upgrade of the main indicators of 【mBDSR】
https://www.gogojungle.co.jp/finance/navi/articles/69373
Euro-OZ, 1-hour chart
On the above 1-hour chart,the initial move of Wave 3is themBDSR (RCI two-filter) pullback buy signallights up. Subsequently,Fibonacci expansion 1.000and the so-calledRCI triple toprise up to.
From this example,the compatibility between trading methods focused on RCI three lines, Wave 3, and Fibonacci expansionandmBDSR signalsis evident.
Indicators that shine in combination with RCI: 【BODSOR・mBDSR】
and methods/case studies (PDF) ★GogoJungle AWARD2020 winner★
https://www.gogojungle.co.jp/tools/indicators/11836
The PDF file contains 301 items (over 1,000 pages, over 350,000 characters).
Many of them are summarized as examples showing how, by linking multiple higher and lower timeframes logically using the three-line RCI, one examines the conditions of multiple lower timeframes sequentially and ultimately waits for pullbacks (or retracements) timing on the lower timeframes (i.e., mBDSR signals).
Additionally,there are many that focus on identifying points where multiple entry criteria overlap..
The explanation usesover 1,000 charts.
× ![]()


