

Pin bar and mBDSR (RCI2 two-filter) bullish signal
New!!※As of May 4, 2024,an upgrade was made to the main indicators of 【mBDSR】
Not only arrow signs, but alerts also trigger when the star sign lights up for the first time.
Also,4K monitor optimizationnow allows even larger display of arrows and stars.
For details, please read the article below on Investment Navi+.
About the version upgrade of the main indicators of 【mBDSR】
https://www.gogojungle.co.jp/finance/navi/articles/69373
In recent Investment Navi+ articles,you can see many examples showing the high compatibility between various trading methods and mBDSR signals.
Dollar/Yen 15-minute chart
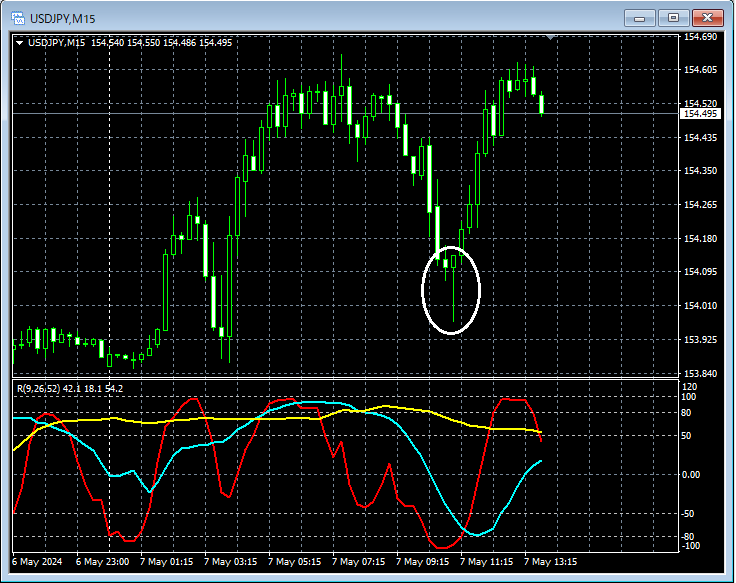
If you look at the area circled in white on the 15-minute chart above, it shows a signal suggesting an risea long lower wick (pin bar)is forming. It might not be unusual to expect a rise from here.
Dollar/Yen 1-minute chart
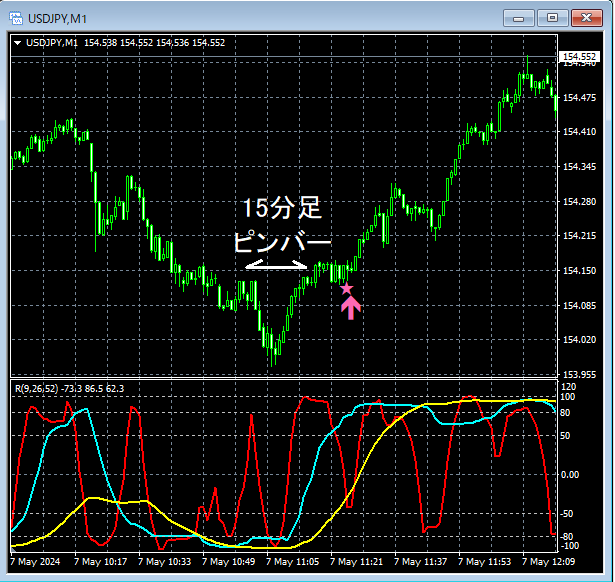
On the 1-minute chart above, after thepin barappears on the 15-minute chart,mBDSR (filters: RCI26 and RCI52)buying on dips signal lights up, and subsequently, the price rises smoothly.
From this example,a trading method focusing on pin barsandmBDSR signalshave high compatibility.
Indicators that are powerful in combination with RCI: 【BODSOR・mBDSR】
and methods/case studies (PDF) ★GogoJungle AWARD 2020 recipient★
https://www.gogojungle.co.jp/tools/indicators/11836
The PDF file includes 301 items (over 1,000 pages, over 350,000 characters).
Most of them are contributions that describe how to logically link higher and lower timeframes using three RCI lines, to examine multiple lower-timeframe conditions sequentially, ultimately waiting for pullbacks on lower timeframes (i.e., mBDSR signals).Additionally,
many entries focus on points where multiple entry reasons overlap..
The explanations useover 1,000 charts.

Not only arrow signs, but alerts also trigger when the star sign lights up for the first time.
Also,4K monitor optimizationnow allows even larger display of arrows and stars.
For details, please read the article below on Investment Navi+.
About the version upgrade of the main indicators of 【mBDSR】
https://www.gogojungle.co.jp/finance/navi/articles/69373
In recent Investment Navi+ articles,you can see many examples showing the high compatibility between various trading methods and mBDSR signals.
Dollar/Yen 15-minute chart
If you look at the area circled in white on the 15-minute chart above, it shows a signal suggesting an risea long lower wick (pin bar)is forming. It might not be unusual to expect a rise from here.
Dollar/Yen 1-minute chart
On the 1-minute chart above, after thepin barappears on the 15-minute chart,mBDSR (filters: RCI26 and RCI52)buying on dips signal lights up, and subsequently, the price rises smoothly.
From this example,a trading method focusing on pin barsandmBDSR signalshave high compatibility.
Indicators that are powerful in combination with RCI: 【BODSOR・mBDSR】
and methods/case studies (PDF) ★GogoJungle AWARD 2020 recipient★
https://www.gogojungle.co.jp/tools/indicators/11836
The PDF file includes 301 items (over 1,000 pages, over 350,000 characters).
Most of them are contributions that describe how to logically link higher and lower timeframes using three RCI lines, to examine multiple lower-timeframe conditions sequentially, ultimately waiting for pullbacks on lower timeframes (i.e., mBDSR signals).Additionally,
many entries focus on points where multiple entry reasons overlap..
The explanations useover 1,000 charts.
× ![]()


