

AUDJPY 1-hour chart mbDSR (two moving average lines filter) overbought/overbought? Actually訳: "戻り売りサインと押し目買いサイン" translates to "resistance-retest selling signal and pullback buying signal" but let's craft accurately: Translation: AUDJPY 1-hour chart mbDS
0
New!!※On May 4, 2024【mBDSR】 Major indicators upgradehas been carried out.
Not only the arrow signs, but also alerts when the star sign lights up for the first time are now possible.
Also,4K monitor supportallows the arrows and stars to be displayed even larger.
Please see the article below in Investment Navi+ for details.
About upgrading the major indicators of mBDSR
https://www.gogojungle.co.jp/finance/navi/articles/69373
AUD/JPY 1-hour chart
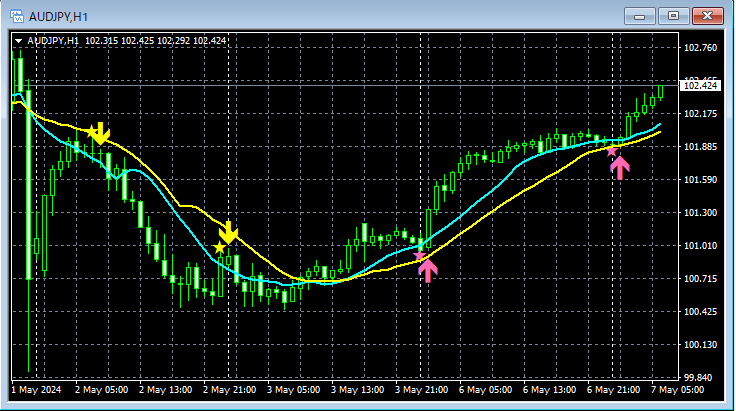
In the 1-hour chart above,mBDSR (two moving average lines filter) sell signal on pullback and buy signal on dipsare lighting up at timely intervals.
Indicator that shines in combination with RCI【BODSOR・mBDSR】
and methods / case studies (PDF) ★GogoJungle AWARD2020 winner★
https://www.gogojungle.co.jp/tools/indicators/11836
The PDF file includes 301 items (over 1,000 pages, over 350,000 characters in total).
Many of them areexamples that break down the process of logically linking higher and lower timeframes using three RCI lines, examining the conditions of multiple lower timeframes in sequence, and ultimately waiting for the timing of dips (or pullbacks) on the lower timeframe signals (i.e., mBDSR signals)..
Also,many focus on capturing points where multiple entry reasons overlap.
The explanations useover 1,000 charts..

Not only the arrow signs, but also alerts when the star sign lights up for the first time are now possible.
Also,4K monitor supportallows the arrows and stars to be displayed even larger.
Please see the article below in Investment Navi+ for details.
About upgrading the major indicators of mBDSR
https://www.gogojungle.co.jp/finance/navi/articles/69373
AUD/JPY 1-hour chart
In the 1-hour chart above,mBDSR (two moving average lines filter) sell signal on pullback and buy signal on dipsare lighting up at timely intervals.
Indicator that shines in combination with RCI【BODSOR・mBDSR】
and methods / case studies (PDF) ★GogoJungle AWARD2020 winner★
https://www.gogojungle.co.jp/tools/indicators/11836
The PDF file includes 301 items (over 1,000 pages, over 350,000 characters in total).
Many of them areexamples that break down the process of logically linking higher and lower timeframes using three RCI lines, examining the conditions of multiple lower timeframes in sequence, and ultimately waiting for the timing of dips (or pullbacks) on the lower timeframe signals (i.e., mBDSR signals)..
Also,many focus on capturing points where multiple entry reasons overlap.
The explanations useover 1,000 charts..
× ![]()


